FIGURE SUMMARY
Title

Endothelial versus pronephron fate decision is modulated by the transcription factors Cloche/Npas4l, Tal1, and Lmo2

Authors
Mattonet, K., Riemslagh, F.W., Guenther, S., Prummel, K.D., Kesavan, G., Hans, S., Ebersberger, I., Brand, M., Burger, A., Reischauer, S., Mosimann, C., Stainier, D.Y.R.
Source
Full text @ Sci Adv

Fig. 1. Generation and use of a knock-in reporter to trace npas4l-expressing cells in wild-type and mutant embryos.
(A) An npas4l-p2a-Gal4-VP16 allele (bns313) was generated by knock-in at the 3′ end of the npas4l coding sequence. Subsequently, a knockout derivative of this allele, one lacking Npas4l function, was generated by mutating the DNA binding domain–encoding region. (B and B′) Use of a Tg(UAS:GFP) background to reveal the lack of intersomitic vessels (ISVs) in npas4l bns423 mutants; (B) shows an npas4l+/+ embryo from an intercross of npas4lbns313 hets, and (B′) shows an npas4l−/− embryo from an intercross of npas4lbns423 hets. (C and C′) npas4l reporter expression in the vasculature of npas4l+/− (left) and npas4l−/− (right) embryos. npas4l reporter expression marks endothelial cells in npas4l heterozygous embryos but skeletal muscle (M) and a ventral row of round cells in npas4l mutants (arrowheads). DA, dorsal aorta; PCV, posterior cardinal vein. Scale bars, 200 μm (B) and 50 μm (C).

Fig. 2. npas4l reporter–expressing cells are observed in pronephron tubules and skeletal muscle in npas4l mutants.
(A) npas4l reporter expression in ventral cells of 24 hpf npas4l+/− (left) and npas4l−/− (right) embryos. The main axial vessels (DA and PCV) are visible in npas4l+/− embryos, while only the more ventrally located cells are detected in npas4l−/− embryos (arrowheads). (B) Transverse sections of 20 hpf npas4l+/− (left) and npas4l−/− (right) embryos. The endothelial progenitors (outlined by yellow dotted lines) in npas4l mutants fail to reach the midline unlike those in wild-type siblings; they also remain round. The round ventrolateral npas4l reporter–expressing cells in npas4l−/− embryos also express Pax2a and are part of the pronephron tubules. (C to E) Numbers of npas4l reporter/Pax2a double-positive cells (C), all Pax2a-positive cells (D), and npas4l reporter–expressing skeletal muscle cells (E) per field of view (319.45-μm-long area over the yolk extension). Cells were counted in three-dimensional (3D) confocal lateral views of npas4l+/+, npas4l+/−, and npas4l−/− embryos at 24 hpf. Data are represented as individual data points, median, interquartile range, and extremes excluding outliers. P values were calculated by Poisson regression and adjusted to counteract the multiple testing problem. Data represent a subset of the data shown in Fig. 6 (B to D). DA, dorsal aorta; PCV, posterior cardinal vein. Scale bars, 50 μm (A) and 10 μm (B).

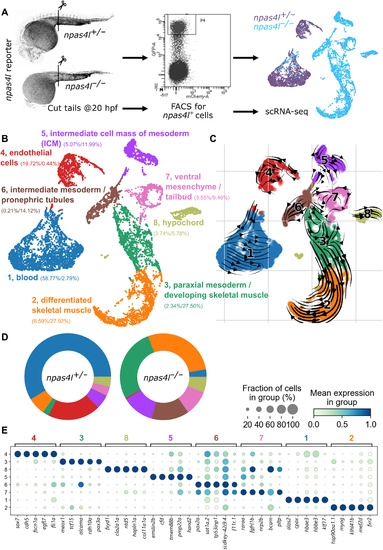
Fig. 3. Transcriptomic profiling of npas4l reporter–expressing cells in npas4l+/− and npas4l−/− embryos. (A) Schematic of the experimental protocol. 5207 and 5262 npas4l reporter–expressing cells from the posterior half of 20 hpf npas4l+/− and npas4l−/− embryos, respectively, were sequenced using the 10x Genomics sequencing platform. FACS, fluorescence-activated cell sorting. (B) Uniform manifold approximation and projection (UMAP) representation of the data clustered by the Leiden algorithm. Numbers between parentheses indicate the percentage of heterozygous/mutant cells contributing to the cluster. (C) Velocity analysis done by comparing pre-mRNA and mRNA levels to infer the relation between the cells in a cluster. (D) Cluster composition per genotype. Graphical representation of the numbers displayed in (B). The main clusters increasing in npas4l−/− compared with npas4l+/− siblings are paraxial mesoderm (cluster 3), skeletal muscle (cluster 2), and intermediate mesoderm (cluster 6). (E) Dot plot with the top five markers separating the clusters. Pseudobulk expression data and marker genes used to separate the clusters can be found in tables S1 and S2, respectively. Differential gene expression in pseudo-bulk analysis can be found in table S3. The full and annotated dataset can be explored at https://bioinformatics.mpi-bn.mpg.de/20hpf_npas4l_expressing_cell or downloaded as an annotated data file using the link https://figshare.com/s/e6bdd5be14c7085d606c.

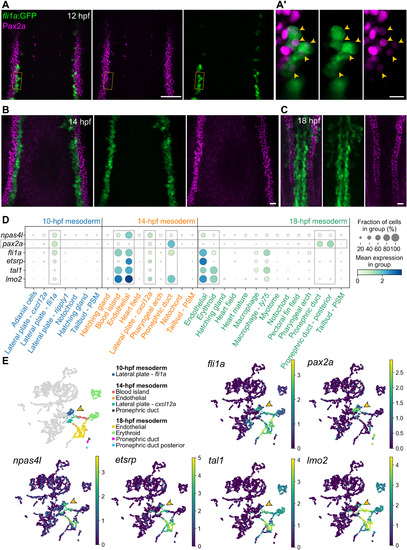
Fig. 4. fli1a and pax2a/Pax2a expression overlap during early stages of wild-type development and largely segregate before 14 hpf. Confocal imaging reveals overlapping expression of fli1a:GFP and Pax2a (A), which decreases by 14 hpf (B), and is not detected at 18 hpf (C). Images of individual 0.74 μm optical sections (A′) clearly suggest colocalization. Yellow arrowheads point to double-positive cells. (D) Mapping of 10 to 18 hpf mesodermal cells from a single-cell time course dataset (39) suggests coexpression of endothelial markers and pax2a at 10 hpf, which decreases over time. PSM, presomitic mesoderm. (E) UMAP plots showing the expression of npas4l, pax2a, fli1a, tal1, lmo2, and etsrp; arrowheads point to the 10 hpf fli1a/pax2a double-positive cluster. Relevant clusters have been color-coded in the left plot in (E) and boxed with dotted lines in (D). “Pronephric duct” = pronephron tubule. Scale bars, 50 μm (A), 10 μm (A′), and 20 μm (B and C).

EXPRESSION / LABELING:
Gene:
Fish:
Anatomical Terms:
Stage Range: 5-9 somites to 14-19 somites
PHENOTYPE:
Fish:
Observed In:
Stage: 10-13 somites

Fig. 5. Lineage tracing of pax2a-expressing cells labels endothelial cells.
(A) Schematic representation of the pax2a:cre:ERT2 knock-in line. pax2a:creERT2 zebrafish were crossed with hsp70l:Switch zebrafish, and the resulting embryos were treated with 4-OHT from 10 to 24 hpf or 16 to 36 hpf and heat-shocked at 72 hpf for 1 hour. TS, transcriptional start. Several pax2a:creERT2 switched EGFP-positive endothelial cells (arrows) can be observed in zebrafish treated with 4-OHT from 10 (B) or 16 (C) hpf. Arrowheads point to pronephron cells, and asterisks indicate spinal cord neurons. Recombined circulating blood cells can be seen in movie S2. 5′UTR, 5′ untranslated region. (D) Quantification shows a decrease in the number of recombined endothelial cells in the animals treated starting at 16 hpf compared with those treated starting at 10 hpf. (E) Schematic representation of the pax2a:creERT2-mediated recombination of an lmo2:Switch line. (F) Recombined endothelial cells (arrow) are observed in the trunk and tail of lmo2:Switch larvae. Scale bars, 500 μm.

Fig. 6. Endothelial progenitors exhibit distinct defects in npas4l, etsrp, tal1, and lmo2 mutants.
(A) Generation of etsrp, tal1, and lmo2 mutants containing in-frame or out-of-frame indels. aa, amino acid. (B to D) Numbers of (B) npas4l reporter and Pax2a double-positive cells, (C) all Pax2a-expressing cells, and (D) npas4l reporter–expressing skeletal muscle cells, per field of view (319.45 μm long area over the yolk extension). Cells were counted in 3D confocal lateral views at 24 hpf. Data are represented as individual data points, median, interquartile range, and extremes excluding outliers. P values were calculated by Poisson regression and adjusted to counteract the multiple testing problem. A subset of these data is also shown in Fig. 2 (C to E). (E) Transverse sections of npas4l+/−, npas4l−/−, etsrp−/−, tal1−/−, and lmo2−/− embryos at 24 hpf; endothelial progenitors and endothelial cells outlined by yellow dotted lines. Major axial vessels form in npas4l+/− embryos, while in npas4l−/− embryos, endothelial progenitors fail to migrate or to express the fli1a:GFP reporter. In etsrp−/− embryos, endothelial progenitors migrate but fail to form vessels. In tal1−/− and lmo2−/− embryos, endothelial progenitor migration is partly impaired; the endothelial progenitors that do reach the midline differentiate and express fli1a:GFP. Scale bars, 20 μm.

Fig. 7. tal1 overexpression rescues endothelial development in npas4l mutants in an Etsrp-dependent manner.
(A) npas4l and tal1 mRNA injections rescue ISV formation in npas4l mutants. (B) Quantification of rescue: mRNA injections of npas4l and tal1, but not of etsrp or lmo2, rescue the ISV defects in npas4l−/− embryos. Data are represented as individual data points, median, interquartile range, and extremes excluding potential outliers. P values were calculated by Poisson regression and adjusted for multiple comparisons between six groups using the Bonferroni correction. (C) tal1 mRNA injections do not rescue the vascular phenotype in etsrp−/− embryos. Data are represented as individual data points, median, interquartile range, and extremes excluding outliers. P values were calculated by Poisson regression. (D and E) etsrp mRNA injections do not increase tal1 mRNA levels at the tailbud stage, whereas tal1 mRNA injections lead to increased etsrp mRNA levels at the same stage. Data are represented as individual data points as well as means ± SD. P values were calculated by unpaired two-sample t test and adjusted for multiple comparisons between five groups using the Bonferroni correction. (F) Uninjected and tal1 mRNA-injected npas4l+/− and npas4l−/− embryos. Ventrolateral npas4l reporter–expressing cells (arrowheads) are not present in tal1 mRNA-injected npas4l−/− embryos, while the contribution of npas4l reporter–expressing cells to skeletal muscle (M) does not appear to be blocked. Scale bars, 500 μm (A) and 50 μm (F). P values were adjusted to counteract the multiple testing problem.

Acknowledgments
This image is the copyrighted work of the attributed author or publisher, and ZFIN has permission only to display this image to its users. Additional permissions should be obtained from the applicable author or publisher of the image. Full text @ Sci Adv