
- Title
-
Macrophages and neutrophils are necessary for ER stress-induced β cell loss
- Authors
- Yang, B., Yang, L., Wang, Y., Maddison, L.A., Tang, Z., Haigh, S., Gong, Y., Zhang, Y., Covington, B.A., Bosma, K.J., Tong, X., Page-McCaw, P., Gannon, M., Deng, Q., Chen, W.
- Source
- Full text @ Cell Rep.
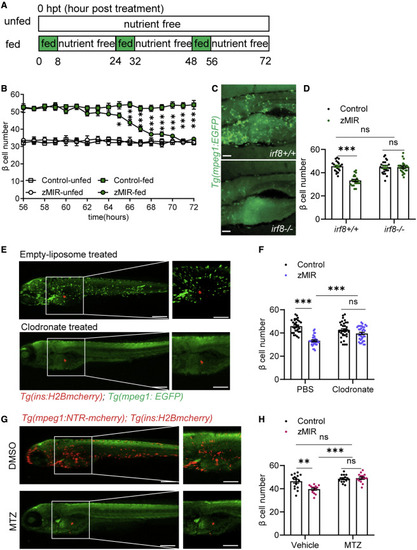
Figure 1. Macrophages are necessary for β cell loss in the setting of overnutrition (A) Schematic of the feeding regimen. Each day, fish were cultured for 8 h in nutrient-rich medium (5% chicken egg yolk) and for 16 h in nutrient-free medium, as indicated by the green and white rectangles, respectively. The 8-h culture in nutrient-rich medium is referred to as an overnutrition session. Time 0 starts at the onset of the first overnutrition 6 days post fertilization. (B) Detailed β-cell number dynamics during the 16 h of nutrient-free medium culture from 56–72 h (n > 15/time point). Data are mean ± SEM. Multiple t tests were performed within the fed and unfed groups. ∗p < 0.05, ∗∗p < 0.01, ∗∗∗p < 0.001. (C) Macrophages in irf8−/− fish (bottom) and control (top). Scale bars, 200 μm. (D) Effect of genetic deficiency of macrophages (irf8−/−) on β cell number. Data are mean ± SEM. n > 15/group, two-way ANOVA followed by Tukey’s multiple comparisons test; ns, not significant; ∗∗∗p < 0.001. (E) Effect of clodronate liposomes (bottom) and empty liposomes (top) on macrophages. A green signal from Tg(mpeg1:EGFP) marks macrophages. A red signal from Tg(ins:H2B-mcherry) labels β cells. Liposomes were injected at 32 hpt, and fish were imaged at 64 hpt. Scale bars, 300 μm; scale bars within panels, 50 μm. See also Figure S1D. (F) Effect of clodronate liposomes on β cell loss in zMIR fish. Data are mean ± SEM. n > 20/group, two-way ANOVA followed by Tukey’s multiple comparisons test; ∗∗∗p < 0.001. (G) Effect of metronidazole (MTZ) and DMSO on macrophages in zMIR fish with Tg(mpeg1:NTR-mcherry). Scale bars, 300 μm; scale bars within panels, 50 μm. See also Figure S1F. (H) Effect of macrophage ablation by MTZ on β cell loss. Data are mean ± SEM. n > 15/group, two-way ANOVA followed by Tukey’s multiple comparisons test; ∗∗p < 0.01, ∗∗∗p < 0.001. |
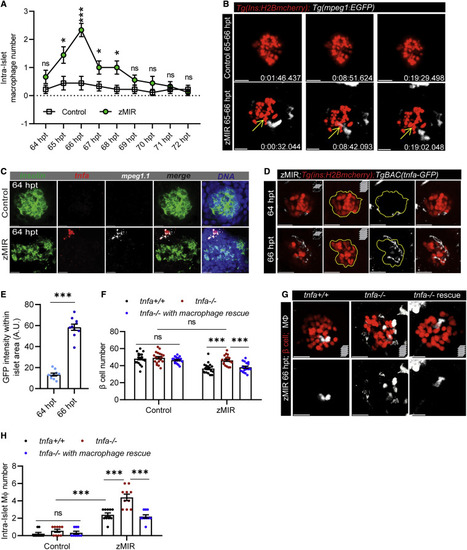
Figure 2. Macrophage-derived Tnfa is necessary for β cell loss in zMIR fish (A) Intra-islet macrophage number in zMIR fish from 64–72 h based on 30 s/frame time-lapse videos hourly. Data represent means ± SEM, n ≥ 10 per group, multiple t tests; ∗p < 0.05, ∗∗∗p < 0.001. (B) Macrophage surveillance of the principal islet during 65–66 hpt in zMIR and control fish, showing that macrophage-contacted β cells remained intact. Live imaging videos were recorded at 30-s intervals. Yellow arrows indicate a macrophage-contacted β cell. Scale bars, 20 μm. (C) Representative RNAscope images of insulin, mpeg1.1, tnfa expression at 64 h in control and zMIR fish. Scale bars, 20 μm. (D) Islet images of TgBAC(tnfa:GFP), Tg(ins:H2B-mCherry), zMIR fish at 64 and 66 h. The GFP signal was detected by immunofluorescence. Scale bars, 20 μm. (E) Quantification of GFP signals in the islet area (outline in D). Data are mean ± SEM, n = 10/group, unpaired t test; bar graphs represent mean ± SEM; ∗∗∗p < 0.001. (F) The effect of tnfa re-expression in macrophages on β cell loss in zMIR fish. Data are mean ± SEM, n > 15/group, two-way ANOVA followed by Tukey’s multiple comparisons test; ∗∗∗p < 0.001. (G) Representative images showing increased intra-islet macrophages in zMIR fish with different tnfa genotypes (+/+, −/−, and −/− with macrophage rescue). Red marks β cells, and white labels macrophages. Scale bars, 10 μm. (H) Quantification of intra-islet macrophages in zMIR fish with different tnfa genotypes (+/+, −/−, and −/− with macrophage rescue) at 66 hpt. Data are mean ± SEM, n = 10 per group, two-way ANOVA followed by Tukey’s multiple comparisons test; ∗∗∗p < 0.001. |
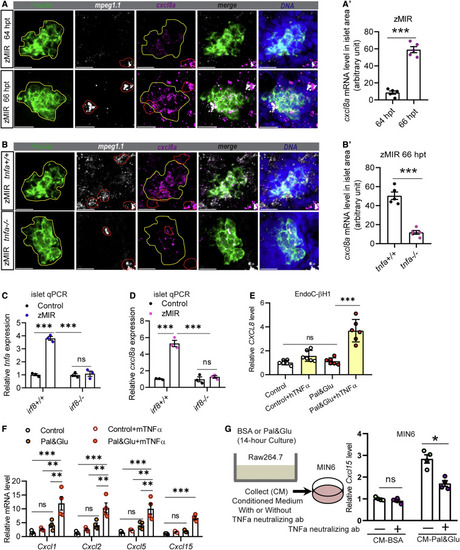
Figure 3. A conserved TNFA-CXCL8 axis in β cells under ER stress (A) Representative RNAscope images of insulin, mpeg, and cxcl8a expression at 64 and 66 h zMIR fish. A yellow line in each image outlines the islet, and a red line outlines macrophages. Scale bars, 20 μm. (A′) Quantification of cxcl8a signals in the islet area (outlined in yellow) from RNAscope images at 64 and 66 h in zMIR fish. Unpaired t test; bar graphs represent mean ± SEM; n = 5/group, ∗∗∗p < 0.001. (B) Representative RNAscope images of insulin, mpeg, and cxcl8a expression at 66 h in tnfa−/−, zMIR and control zMIR fish. Scale bars, 20 μm. (B′) Quantification of cxcl8a signals in the islet area (outlined in yellow) from RNAscope images at 66 h in tnfa−/−, zMIR, and control zMIR fish. Unpaired t test; bar graphs represent mean ± SEM; n = 5/group; ∗∗∗p < 0.001. (C) Islet qRT-PCR analysis of tnfa at 66 hpt in irf8−/−, zMIR, and control zMIR fish. Data are mean ± SEM; n = 3/group; two-way ANOVA followed by Tukey’s multiple comparisons test; ∗∗∗p < 0.001. (D) Islet qRT-PCR analysis of islet cxcl8a expression at 66 hpt in irf8−/−, zMIR, and control zMIR fish. Data are mean ± SEM. n = 3/group, two-way ANOVA followed by Tukey’s multiple comparisons test; ∗∗∗p < 0.001. (E) Effect of TNFA treatment on CXCL8 expression in EndoC-H1 cells cultured under high-palmitate (0.5 mM) and glucose (25 mM) conditions (pal&glu). Data are mean ± SEM. n = 6/group, one-way ANOVA followed by Tukey’s multiple comparisons test; ∗∗∗p < 0.001. (F) Effect of TNFA treatment on expression of Cxcl1, Cxcl2, Cxcl5, and Cxcl15 in MIN6 cells under pal&glu conditions. Data are mean ± SEM. n = 4/group, one-way ANOVA followed by Tukey’s multiple comparisons test; ∗∗p < 0.01, ∗∗∗p < 0.001. (G) Effect of the TNFA-neutralizing antibody on Cxcl15 expression in MIN6 cells cultured in Raw264.7 conditioned medium. The schematic shows generation of Raw264.6 conditioned medium for MIN6 cells. Neutralized TNFA significantly decreases induction of cxcl15 expression under conditioned medium in MIN6 cells. Data are mean ± SEM. n = 4/group, multiple t tests; ∗p < 0.05. |
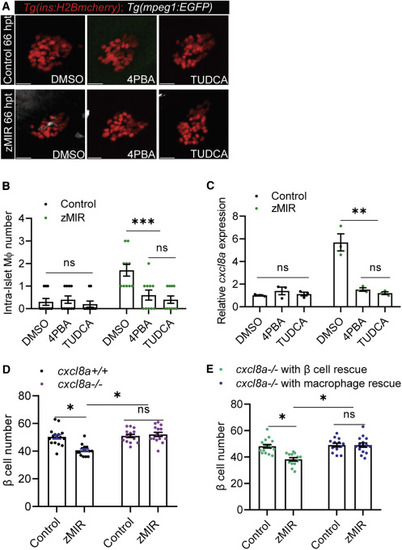
Figure 4. β cell-derived Cxcl8a is required for β cell loss in zMIR fish (A) Representative images of intra-islet macrophages in control and zMIR fish treated with DMSO (vehicle), TUDCA, and 4-PBA at 66 hpt. Red cells are islet β cells, and white cells are macrophages. Scale bars, 10 μm. (B) Intra-islet macrophage numbers in control and zMIR fish treated with DMSO (vehicle), TUDCA, and 4-PBA at 66 hpt. Data are mean ± SEM. n = 10/group, two-way ANOVA followed by Tukey’s multiple comparisons test; ∗∗∗p < 0.001. (C) Islet qRT-PCR analysis of cxcl8a at 66 hpt in control and zMIR fish treated with DMSO (vehicle), TUDCA, and 4-PBA at 66 hpt. Data are mean ± SEM. n = 3/group, two-way ANOVA followed by Tukey’s multiple comparisons test; ∗∗p < 0.01. (D) β Cell numbers in zMIR fish with or without cxcl8a function. Data are mean ± SEM. n = 15/group, two-way ANOVA followed by Tukey’s multiple comparisons test; ∗p < 0.05. (E) β Cell numbers in cxcl8a−/−, zMIR fish with cxcl8a rescue in β cells or macrophages. The rescue was achieved by Tg(ins:cxcl8a-P2A-nEGFP) and Tg(mpeg1:cxcl8a-P2A-tagRFPcaax), respectively. Data are mean ± SEM. n > 10/group, two-way ANOVA followed by Tukey’s multiple comparisons test; ∗p < 0.05. |
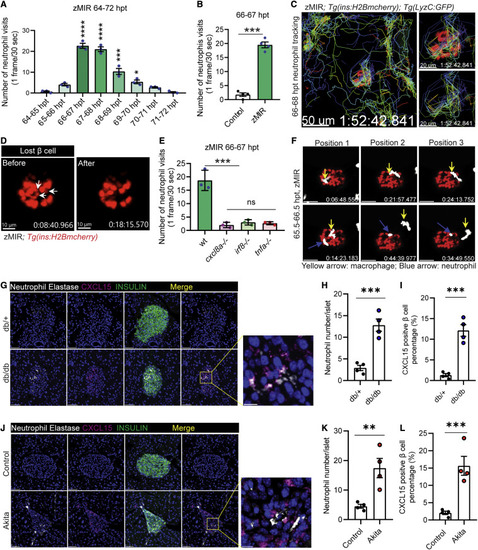
Figure 5. Cxcl8a is necessary for recruiting neutrophils to the islet (A) Quantification of islet visits by neutrophils in live imaging videos from 64–72 h. Videos were recorded at 30 s/frame. Data are mean ± SEM. n = 3/group, one-way ANOVA followed by Tukey’s multiple comparisons test; ∗p < 0.05, ∗∗∗p < 0.001, ∗∗∗∗p < 0.0001. (B) Quantification of islet visits by neutrophils in 30 s/frame live imaging videos of control and zMIR fish from 66–67 h. Unpaired t test; n = 4/group; bar graphs represent mean ± SEM; ∗∗∗p < 0.001. See also Videos S1A and S1B. (C) Representative tracks of neutrophil movement in the islet vicinity in a zMIR fish from 66–68 h. Scale bars, 50 μm. See also Video S2. (D) β cell loss during the 67–68 hpt interval in a representative islet. White arrows point to the β cells lost during the interval. Scale bars, 15 μm. See also Video S3C. (E) Quantification of islet visits by neutrophils in live imaging videos of tnfa−/−, zMIR fish; irf8−/−, zMIR fish; cxcl8a−/−, zMIR fish, and control zMIR fish from 66–67 h. Videos were recorded at 30 s/frame. Data are mean ± SEM. n = 3/group, one-way ANOVA followed by Tukey’s multiple comparisons test; ∗∗∗p < 0.001. (F) Representative video frames showing neutrophils tracking a macrophage in the principal islet in zMIR fish from 66–67 hpt. Yellow arrows point to macrophages, and blue arrows point to neutrophils. Videos were recorded at 30-s intervals. Macrophages were distinguished from neutrophils by their morphological irregularity and lower velocity. See also Video S3D. (G) Representative immunofluorescence images of neutrophil elastase and CXCl15 in pancreas sections of 8-week-old db/+ (B6.BKS(D)-Leprdb/J) and db/db mice. Scale bars, 50 μm. Inset: contact between neutrophils and CXCl15-positive β cells. Scale bars, 10 μm. (H) Quantification of intra-islet neutrophil numbers of db/+ and db/db mice (n = 4; at least 50 islets were quantified in each animal). Unpaired t test, bar graphs represent mean ± SEM, ∗∗∗p < 0.001. (I) Quantification of CXCL15-positive β cells in db/+ and db/db mice (n = 4; at least 50 islets were quantified in each animal). Unpaired t test, bar graphs represent mean ± SEM, ∗∗∗p < 0.001. (J) Representative immunofluorescence images of neutrophil elastase and CXCl15 in pancreas sections of 8-week-old control (C57BL/6) and Akita (C57BL/6-Ins2Akita/J) mice. Scale bars, 50 μm. Inset: contacts between neutrophils and CXCl15-positive β cells. Scale bars, 10 μm. (K) Quantification of intra-islet neutrophil numbers of control and Akita mice (n = 4; at least 50 islets were quantified in each animal). Unpaired t test, bar graphs represent mean ± SEM, ∗∗p < 0.01. (L) Quantification of CXCL15-positive β cells in control and Akita mice (n = 4; at least 50 islets were quantified in each animal). Unpaired t test, bar graphs represent mean ± SEM, ∗∗∗p < 0.001. |
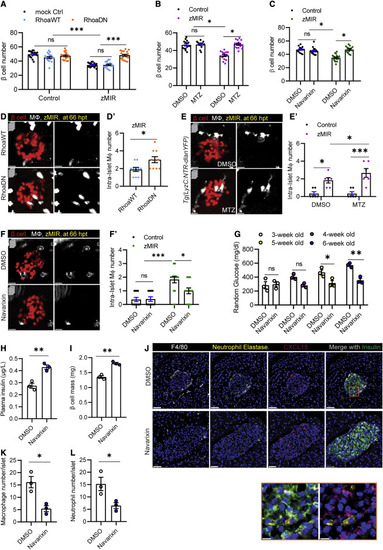
Figure 6. Islet neutrophils are necessary for β cell loss (A) Effect of impairing neutrophil motility on β cell loss. Data are mean ± SEM. n > 10/group, two-way ANOVA followed by Tukey’s multiple comparisons test; ∗∗∗p < 0.001. (B) Effect of MTZ-NTR-mediated neutrophil ablation on β cell loss. Data are mean ± SEM. n > 10/group, two-way ANOVA followed by Tukey’s multiple comparisons test; ∗p < 0.05. (C) Effect of the Cxcr1/2 antagonist on β cell loss. Data are mean ± SEM. n > 10 per group, two-way ANOVA followed by Tukey’s multiple comparisons test; ∗p < 0.05. (D) Representative images of intra-islet macrophages in zMIR fish with Tg(LyzC:mCherry-2a-RhoaDN) (labeled RhoaDN) or Tg(LyzC:mCherry-2a-RhoaWT) (labeled RhoaWT) at 66 hpt, showing β cells (red) and macrophages (white). Scale bars, 10 μm. (D′) Quantification of intra-islet macrophages in zMIR fish with Tg(LyzC:mCherry-2a-RhoaDN) or Tg(LyzC:mCherry-2a-RhoaWT). Unpaired t test, n = 10, bar graphs represent mean ± SEM, ∗p < 0.05. (E) Representative images of intra-islet macrophages in zMIR, Tg(LyzC:NTR-dlanYFP) fish treated with DMSO or MTZ (2.5 mM) at 66 hpt, showing β cells (red) and macrophages (white). Scale bars, 10 μm. (E′) Quantification of intra-islet macrophages in zMIR fish with or without neutrophil depletion. Data are mean ± SEM. n = 6/group, two-way ANOVA followed by Tukey’s multiple comparisons test; ∗p < 0.05, ∗∗∗p < 0.001. (F) Representative images of intra-islet macrophages in control fish and zMIR fish at 66 hpt after treatment with DMSO or navarixin (10 μM), showing β cells (red) and macrophages (white). Scale bars, 10 μm. (F′) Quantification of intra-islet macrophages in zMIR fish treated with vehicle or navarixin. Data are mean ± SEM. n = 10/group, two-way ANOVA followed by Tukey’s multiple comparisons test; ∗p < 0.05, ∗∗∗p < 0.001. (G) Weekly random blood glucose levels in Akita (C57BL/6-Ins2Akita/J) mice with daily peritoneal injection of DMSO or navarixin (5 μg/g), starting at 3 weeks of age (day 21). Unpaired t test, n = 3/group, bar graphs represent mean ± SEM; ∗p < 0.05, ∗∗p < 0.01. (H) Plasma insulin levels in Akita (C57BL/6-Ins2Akita/J) mice after 3 weeks of daily injections of DMSO or navarixin (5 μg/g). Unpaired t test, n = 3/group, bar graphs represent mean ± SEM, ∗∗p < 0.01. (I) β Cell mass of Akita (C57BL/6-Ins2Akita/J) mice after 3 weeks of injection with DMSO or navarixin (5 μg/g). Unpaired t test, n = 3/group, bar graphs represent mean ± SEM, ∗∗p < 0.01. (J) Representative immunofluorescence images of neutrophil elastase, F4/80, insulin, and CXCl15 in pancreas sections of Akita (C57BL/6-Ins2Akita/J) mice after 3 weeks of daily injections of DMSO or navarixin (5 μg/g). Scale bars, 50 μm. Inset: contacts between neutrophils and CXCL15-positive β cells. Scale bars, 10 μm. (K) Quantification of intra-islet neutrophil numbers of Akita (C57BL/6-Ins2Akita/J) mice after 3 weeks of daily injections of DMSO or navarixin (n = 3; at least 50 islets were quantified in each animal). Unpaired t test, bar graphs represent mean ± SEM, ∗p < 0.05. (L) Quantification of intra-islet macrophage numbers in pancreas sections of Akita (C57BL/6-Ins2Akita/J) mice after 3 weeks of daily injections of DMSO or navarixin (n = 3; at least 50 islets were quantified in each animal). Unpaired t test, bar graphs represent mean ± SEM, ∗p < 0.05. |