
Fig. 5
- ID
- ZDB-FIG-220830-13
- Publication
- Yang et al., 2022 - Macrophages and neutrophils are necessary for ER stress-induced β cell loss
- Other Figures
- All Figure Page
- Back to All Figure Page
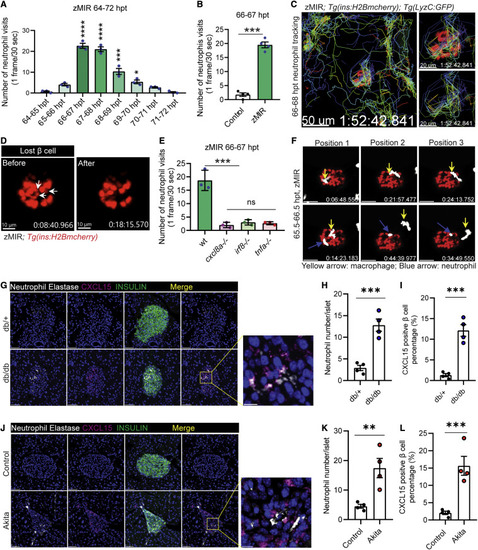
Figure 5. Cxcl8a is necessary for recruiting neutrophils to the islet (A) Quantification of islet visits by neutrophils in live imaging videos from 64–72 h. Videos were recorded at 30 s/frame. Data are mean ± SEM. n = 3/group, one-way ANOVA followed by Tukey’s multiple comparisons test; ∗p < 0.05, ∗∗∗p < 0.001, ∗∗∗∗p < 0.0001. (B) Quantification of islet visits by neutrophils in 30 s/frame live imaging videos of control and zMIR fish from 66–67 h. Unpaired t test; n = 4/group; bar graphs represent mean ± SEM; ∗∗∗p < 0.001. See also Videos S1A and S1B. (C) Representative tracks of neutrophil movement in the islet vicinity in a zMIR fish from 66–68 h. Scale bars, 50 μm. See also Video S2. (D) β cell loss during the 67–68 hpt interval in a representative islet. White arrows point to the β cells lost during the interval. Scale bars, 15 μm. See also Video S3C. (E) Quantification of islet visits by neutrophils in live imaging videos of tnfa−/−, zMIR fish; irf8−/−, zMIR fish; cxcl8a−/−, zMIR fish, and control zMIR fish from 66–67 h. Videos were recorded at 30 s/frame. Data are mean ± SEM. n = 3/group, one-way ANOVA followed by Tukey’s multiple comparisons test; ∗∗∗p < 0.001. (F) Representative video frames showing neutrophils tracking a macrophage in the principal islet in zMIR fish from 66–67 hpt. Yellow arrows point to macrophages, and blue arrows point to neutrophils. Videos were recorded at 30-s intervals. Macrophages were distinguished from neutrophils by their morphological irregularity and lower velocity. See also Video S3D. (G) Representative immunofluorescence images of neutrophil elastase and CXCl15 in pancreas sections of 8-week-old db/+ (B6.BKS(D)-Leprdb/J) and db/db mice. Scale bars, 50 μm. Inset: contact between neutrophils and CXCl15-positive β cells. Scale bars, 10 μm. (H) Quantification of intra-islet neutrophil numbers of db/+ and db/db mice (n = 4; at least 50 islets were quantified in each animal). Unpaired t test, bar graphs represent mean ± SEM, ∗∗∗p < 0.001. (I) Quantification of CXCL15-positive β cells in db/+ and db/db mice (n = 4; at least 50 islets were quantified in each animal). Unpaired t test, bar graphs represent mean ± SEM, ∗∗∗p < 0.001. (J) Representative immunofluorescence images of neutrophil elastase and CXCl15 in pancreas sections of 8-week-old control (C57BL/6) and Akita (C57BL/6-Ins2Akita/J) mice. Scale bars, 50 μm. Inset: contacts between neutrophils and CXCl15-positive β cells. Scale bars, 10 μm. (K) Quantification of intra-islet neutrophil numbers of control and Akita mice (n = 4; at least 50 islets were quantified in each animal). Unpaired t test, bar graphs represent mean ± SEM, ∗∗p < 0.01. (L) Quantification of CXCL15-positive β cells in control and Akita mice (n = 4; at least 50 islets were quantified in each animal). Unpaired t test, bar graphs represent mean ± SEM, ∗∗∗p < 0.001. |