
Fig. 3
- ID
- ZDB-FIG-220830-11
- Publication
- Yang et al., 2022 - Macrophages and neutrophils are necessary for ER stress-induced β cell loss
- Other Figures
- All Figure Page
- Back to All Figure Page
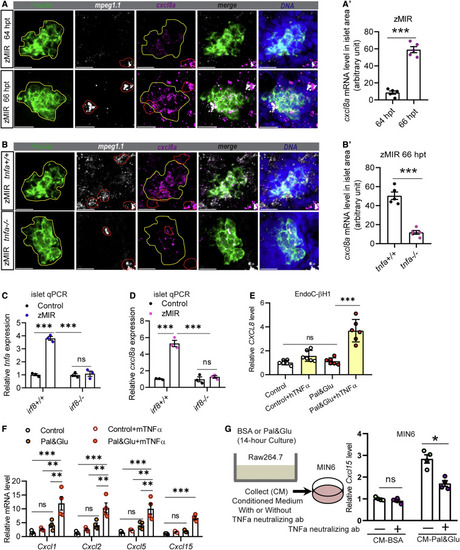
Figure 3. A conserved TNFA-CXCL8 axis in β cells under ER stress (A) Representative RNAscope images of insulin, mpeg, and cxcl8a expression at 64 and 66 h zMIR fish. A yellow line in each image outlines the islet, and a red line outlines macrophages. Scale bars, 20 μm. (A′) Quantification of cxcl8a signals in the islet area (outlined in yellow) from RNAscope images at 64 and 66 h in zMIR fish. Unpaired t test; bar graphs represent mean ± SEM; n = 5/group, ∗∗∗p < 0.001. (B) Representative RNAscope images of insulin, mpeg, and cxcl8a expression at 66 h in tnfa−/−, zMIR and control zMIR fish. Scale bars, 20 μm. (B′) Quantification of cxcl8a signals in the islet area (outlined in yellow) from RNAscope images at 66 h in tnfa−/−, zMIR, and control zMIR fish. Unpaired t test; bar graphs represent mean ± SEM; n = 5/group; ∗∗∗p < 0.001. (C) Islet qRT-PCR analysis of tnfa at 66 hpt in irf8−/−, zMIR, and control zMIR fish. Data are mean ± SEM; n = 3/group; two-way ANOVA followed by Tukey’s multiple comparisons test; ∗∗∗p < 0.001. (D) Islet qRT-PCR analysis of islet cxcl8a expression at 66 hpt in irf8−/−, zMIR, and control zMIR fish. Data are mean ± SEM. n = 3/group, two-way ANOVA followed by Tukey’s multiple comparisons test; ∗∗∗p < 0.001. (E) Effect of TNFA treatment on CXCL8 expression in EndoC-H1 cells cultured under high-palmitate (0.5 mM) and glucose (25 mM) conditions (pal&glu). Data are mean ± SEM. n = 6/group, one-way ANOVA followed by Tukey’s multiple comparisons test; ∗∗∗p < 0.001. (F) Effect of TNFA treatment on expression of Cxcl1, Cxcl2, Cxcl5, and Cxcl15 in MIN6 cells under pal&glu conditions. Data are mean ± SEM. n = 4/group, one-way ANOVA followed by Tukey’s multiple comparisons test; ∗∗p < 0.01, ∗∗∗p < 0.001. (G) Effect of the TNFA-neutralizing antibody on Cxcl15 expression in MIN6 cells cultured in Raw264.7 conditioned medium. The schematic shows generation of Raw264.6 conditioned medium for MIN6 cells. Neutralized TNFA significantly decreases induction of cxcl15 expression under conditioned medium in MIN6 cells. Data are mean ± SEM. n = 4/group, multiple t tests; ∗p < 0.05. |