
|
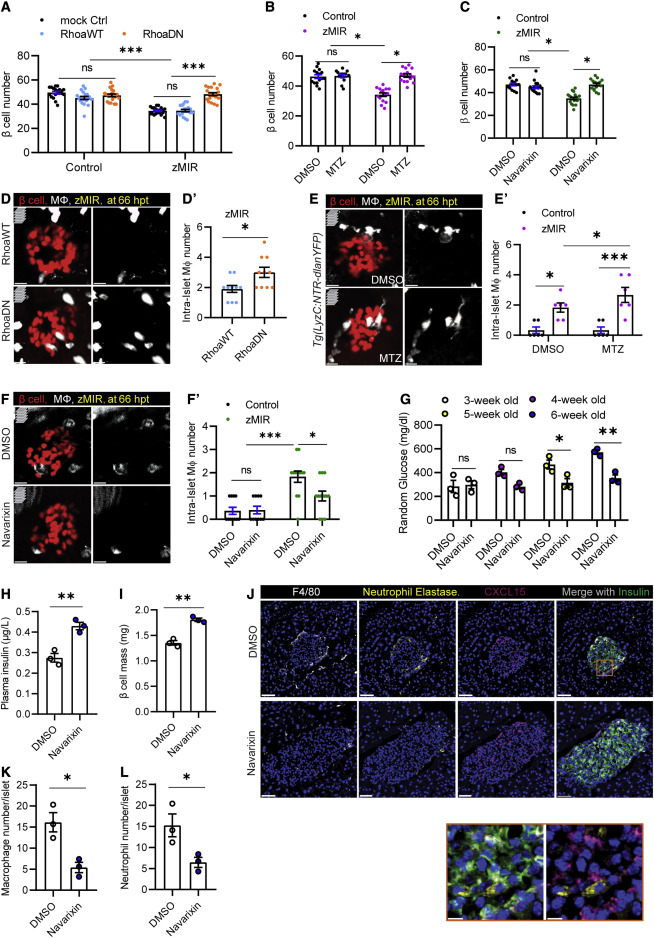
Fig. 6 Figure 6. Islet neutrophils are necessary for β cell loss (A) Effect of impairing neutrophil motility on β cell loss. Data are mean ± SEM. n > 10/group, two-way ANOVA followed by Tukey’s multiple comparisons test; ∗∗∗p < 0.001. (B) Effect of MTZ-NTR-mediated neutrophil ablation on β cell loss. Data are mean ± SEM. n > 10/group, two-way ANOVA followed by Tukey’s multiple comparisons test; ∗p < 0.05. (C) Effect of the Cxcr1/2 antagonist on β cell loss. Data are mean ± SEM. n > 10 per group, two-way ANOVA followed by Tukey’s multiple comparisons test; ∗p < 0.05. (D) Representative images of intra-islet macrophages in zMIR fish with Tg(LyzC:mCherry-2a-RhoaDN) (labeled RhoaDN) or Tg(LyzC:mCherry-2a-RhoaWT) (labeled RhoaWT) at 66 hpt, showing β cells (red) and macrophages (white). Scale bars, 10 μm. (D′) Quantification of intra-islet macrophages in zMIR fish with Tg(LyzC:mCherry-2a-RhoaDN) or Tg(LyzC:mCherry-2a-RhoaWT). Unpaired t test, n = 10, bar graphs represent mean ± SEM, ∗p < 0.05. (E) Representative images of intra-islet macrophages in zMIR, Tg(LyzC:NTR-dlanYFP) fish treated with DMSO or MTZ (2.5 mM) at 66 hpt, showing β cells (red) and macrophages (white). Scale bars, 10 μm. (E′) Quantification of intra-islet macrophages in zMIR fish with or without neutrophil depletion. Data are mean ± SEM. n = 6/group, two-way ANOVA followed by Tukey’s multiple comparisons test; ∗p < 0.05, ∗∗∗p < 0.001. (F) Representative images of intra-islet macrophages in control fish and zMIR fish at 66 hpt after treatment with DMSO or navarixin (10 μM), showing β cells (red) and macrophages (white). Scale bars, 10 μm. (F′) Quantification of intra-islet macrophages in zMIR fish treated with vehicle or navarixin. Data are mean ± SEM. n = 10/group, two-way ANOVA followed by Tukey’s multiple comparisons test; ∗p < 0.05, ∗∗∗p < 0.001. (G) Weekly random blood glucose levels in Akita (C57BL/6-Ins2Akita/J) mice with daily peritoneal injection of DMSO or navarixin (5 μg/g), starting at 3 weeks of age (day 21). Unpaired t test, n = 3/group, bar graphs represent mean ± SEM; ∗p < 0.05, ∗∗p < 0.01. (H) Plasma insulin levels in Akita (C57BL/6-Ins2Akita/J) mice after 3 weeks of daily injections of DMSO or navarixin (5 μg/g). Unpaired t test, n = 3/group, bar graphs represent mean ± SEM, ∗∗p < 0.01. (I) β Cell mass of Akita (C57BL/6-Ins2Akita/J) mice after 3 weeks of injection with DMSO or navarixin (5 μg/g). Unpaired t test, n = 3/group, bar graphs represent mean ± SEM, ∗∗p < 0.01. (J) Representative immunofluorescence images of neutrophil elastase, F4/80, insulin, and CXCl15 in pancreas sections of Akita (C57BL/6-Ins2Akita/J) mice after 3 weeks of daily injections of DMSO or navarixin (5 μg/g). Scale bars, 50 μm. Inset: contacts between neutrophils and CXCL15-positive β cells. Scale bars, 10 μm. (K) Quantification of intra-islet neutrophil numbers of Akita (C57BL/6-Ins2Akita/J) mice after 3 weeks of daily injections of DMSO or navarixin (n = 3; at least 50 islets were quantified in each animal). Unpaired t test, bar graphs represent mean ± SEM, ∗p < 0.05. (L) Quantification of intra-islet macrophage numbers in pancreas sections of Akita (C57BL/6-Ins2Akita/J) mice after 3 weeks of daily injections of DMSO or navarixin (n = 3; at least 50 islets were quantified in each animal). Unpaired t test, bar graphs represent mean ± SEM, ∗p < 0.05.