
- Title
-
Timely Schwann cell division drives peripheral myelination in vivo via Laminin/cAMP pathway
- Authors
- Mikdache, A., Boueid, M.J., Lesport, E., Delespierre, B., Loisel-Duwattez, J., Degerny, C., Tawk, M.
- Source
- Full text @ Development
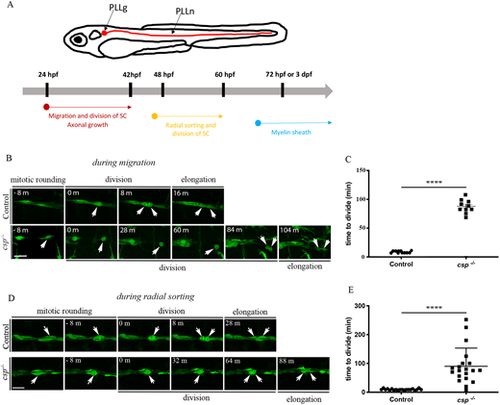
SCs show a regular pattern of division during migration and radial sorting. (A) Timeline of SC behavior and myelination in zebrafish. SCs migrate and divide along growing axons between 24 hpf and 48 hpf. They start to radially sort axons of the PLLn at around 48 hpf and divide intensively. The myelin sheath was analyzed starting from 3 dpf (or 72 hpf). (B) Still images of time-lapse imaging in Tg(foxd3:gfp) control and Tg(foxd3:gfp)/csp−/− embryos at around 30 hpf. Arrows indicate SCs along the PLLn at different time points prior to and after division. Scale bar: 20 µm. (C) Quantification of the time required for control (11 cells from three different embryos) and csp−/− (ten cells from three different embryos) SCs to successfully complete cytokinesis during migration (****P≤0.0001). (D) Still images of time-lapse imaging in Tg(foxd3:gfp) control and Tg(foxd3:gfp)/csp−/− embryos at around 52 hpf. Arrows indicate SCs along the PLLn at different time points prior to and after division. Scale bar: 20 µm. (E) Quantification of the time required for control (20 cells from six different embryos) and csp−/− (20 cells from five different embryos) SCs to successfully complete cytokinesis (****P≤0.0001). m, minutes. |
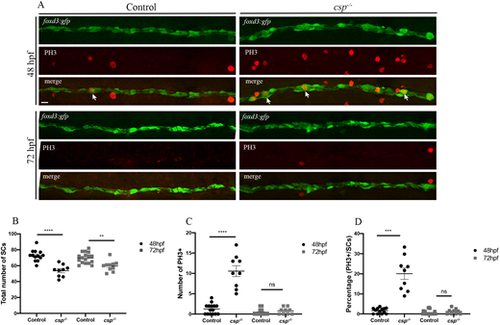
SCs in csp−/− show delays in mitotic progression but exit mitosis with no significant increase in apoptosis. (A) PH3 immunolabeling in Tg(foxd3:gfp) and Tg(foxd3:gfp)/csp−/− larvae at 48 hpf and 72 hpf. Arrows indicate SCs that are GFP and PH3 positive. Scale bar: 25 µm. (B) Quantification of the number of SCs within a defined region of the PLLn at 48 and 72 hpf in control (average of 72.77±1.96 cells at 48 hpf, n=13 embryos; average of 69.60±1.61 cells at 72 hpf, n=17 embryos) and csp−/− (average of 53.67±2.50 cells at 48 hpf, n=9 embryos; average of 59.60±2.10 cells at 72 hpf, n=10 embryos) (****P≤0.0001; **P=0.0012). (C) Quantification of the number of PH3+ SCs within a defined region of the PLLn at 48 and 72 hpf in control (average of 1.26±0.33 cells at 48 hpf, n=15 embryos; average of 0.45±0.17 cells at 72 hpf, n=20 embryos) and csp−/− (average of 10.56±1.34 cells at 48 hpf, n=9 embryos; average of 0.77±0.27 cells at 72 hpf, n=9 embryos) (****P≤0.0001; ns, P=0.33). (D) Quantification of the percentage of PH3+ SCs relative to the total number of SCs within a defined region of the PLLn at 48 and 72 hpf in control (average of 1.68±0.38 cells at 48 hpf, n=13 embryos; average of 0.67±0.26 cells at 72 hpf, n=20 embryos) and csp−/− (average of 20.08±2.83 cells at 48 hpf, n=9 embryos; average of 1.25±0.46 cells at 72 hpf; n=9 embryos) (***P=0.0002; ns, P=0.19). |
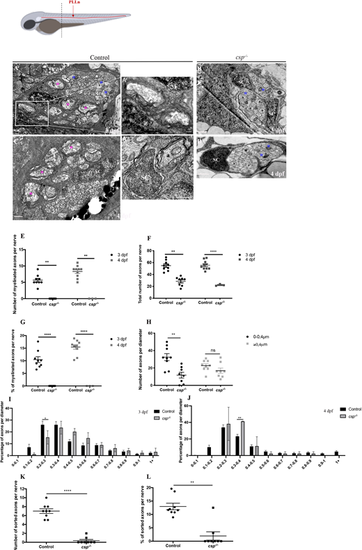
Sil is essential for radial sorting and myelination by SCs. Schematic at the top shows a zebrafish larvae with PLLn shown in red. The dotted line represents the AP position of the cross-section analysis by TEM. (A-D) TEM of a cross-section of the PLLn at 3 dpf in control (A,A′) and csp−/− (B) and at 4 dpf in control (C) and csp−/− (D). Magenta asterisks highlight some large caliber myelinated axons (also shown at higher magnification in A′) and blue asterisks show some large caliber non-myelinated axons. Scale bars: 0.5 µm (A,A″,B-D); 0.2 µm (A′). (A″) Example of a 1:1 association between a SC and an axon at 3 dpf (from a different control embryo). a, axon. Axons remained bundled in csp−/− such that one SC was associated with a bundle of axons, delineated in white in B. (E) Quantification of the number of myelinated axons per nerve at 3 dpf in controls (nine nerves, n=5 embryos) and csp−/− (eight nerves, n=6 embryos) and at 4 dpf in controls (average of 8.3±0.57 myelinated axons; ten nerves, n=6 embryos) and csp−/− (zero myelinated axons; three nerves, n=3 embryos) (**P=0.0035 at 3 dpf; **P=0.005 at 4 dpf). (F) Quantification of the total number of axons per nerve at 3 dpf in controls and csp−/− and at 4 dpf in controls (54±3.16 axons) and csp−/− (23±1 axons) (**P=0.003; ****P≤0.0001). (G) Quantification of the percentage of myelinated axons relative to the total number of axons per nerve at 3 and 4 dpf in controls and csp−/− (****P≤0.0001). (H) Quantification of the number of axons relative to their diameter at 3 dpf in controls (average of 32.44 for 0-0.4 µm; average of 22.67 for >0.4 µm) and csp−/− (average of 11.75 for 0-0.4 µm; average of 16.88 for >0.4 µm) (**P=0.0013; ns, P=0.14). (I) Graph representing the distribution of axons relative to their diameter with 0.1 µm bin width at 3 dpf in controls and csp−/− embryos (*P=0.04). (J) Graph representing the distribution of axons relative to their diameter with 0.1 µm bin width at 4 dpf in controls and csp−/− embryos (**P=0.0015). (K) Quantification of the number of sorted axons per nerve at 3 dpf in control (average of 7.00±0.52) and csp−/− (0.37±0.26) embryos (****P≤0.0001). (L) Quantification of the percentage of sorted axons relative to the total number of axons at 3 dpf in control (12.97±1.21) and csp−/− (1.95±1.55) embryos (**P=0.0019). |
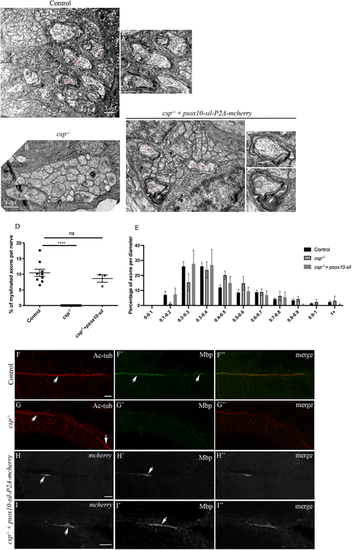
Sil is required within SCs for axonal wrapping. (A-C″) TEM of a cross-section of the PLLn at 3 dpf in control (A,A′), csp−/− (B) and csp−/− embryos injected with psox10-sil-P2A-mCherry (C-C″). Magenta asterisks indicate some large caliber myelinated axons (shown at higher magnification in A′, C′, C″). Scale bars: 0.5 μm (A-C); 0.2 µm (C′,C″). (D) Quantification of the percentage of myelinated axons relative to the total number of axons in control (average of 10.46±1.14%, nine nerves, n=5 embryos), csp−/− (0%, eight nerves, n=6 embryos) and csp−/− injected with psox10-sil-P2A-mCherry (average of 8.64±1.20%, three nerves, n=3 embryos) (****P≤0.0001; ns, P=0.4871). (E) Graph representing the distribution of axons relative to their diameter with 0.1 µm bin width at 3 dpf in controls, csp−/− and csp−/− embryos injected with psox10-sil-P2A-mCherry. (F-I″) Acetylated tubulin (Ac-tub) and Mbp immunolabeling in control (F-F″), csp−/− (G-G″) and csp−/−+psox10-sil-P2A-mCherry (H-I″) embryos at 3 dpf. Arrows indicate the PLLn in F and G, the myelin sheaths in F′, mCherry+ Schwann cells along the PLLn in H and I and the corresponding Mbp expression in H′ and I′. F″, G″, H″ and I″ are the corresponding merge images of F and F′, G and G′, H and H′, I and I′, respectively. Scale bars: 20 μm. |
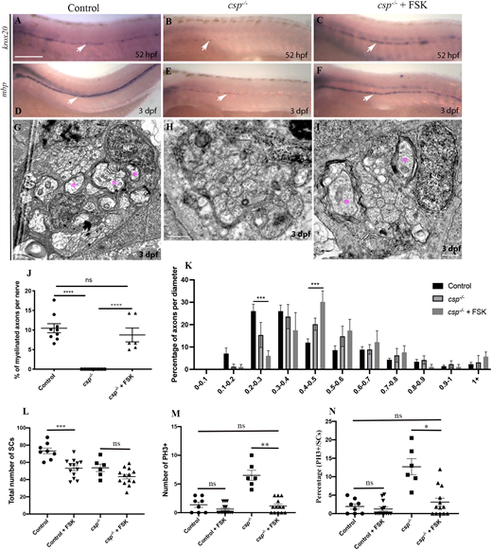
sil is required to initiate myelin gene expression and axonal wrapping by SCs via a cAMP-dependent pathway. (A-C) Lateral views of krox20 expression at 52 hpf revealed by in situ hybridization along the PLLn in control (A) showing a robust expression (n=29 embryos), csp−/− embryo (B) showing a sharp decrease in krox20 expression (n=22 embryos) and in csp−/− treated with FSK (C) showing a robust expression similar to controls (n=30 embryos). Arrows indicate SCs expressing krox20 along the PLLn. (D-F) Lateral views of mbp expression at 3 dpf revealed by in situ hybridization along the PLLn in control (D) showing a robust expression (n=31 embryos), csp−/− embryo (E) showing a sharp decrease in mbp expression (n=24 embryos) and in csp−/− treated with FSK (F) showing a robust expression similar to controls (n=28 embryos). Arrows indicate SCs expressing mbp along the PLLn. Scale bar: 200 μm. (G-I) TEM of a cross-section of the PLLn at 3 dpf in control (G), csp−/− (H) and csp−/− treated with FSK between 45 and 52 hpf (I). Magenta asterisks indicate some large caliber myelinated axons. Scale bars: 0.5 μm. (J) Quantification of the percentage of myelinated axons relative to the total number of axons per nerve at 3 dpf in controls (average of 10.6±1.17), csp−/− (average of 0) and csp−/− treated with FSK (average of 8.74±1.77, six nerves, n=5 embryos) (****P≤0.0001; ns, P=0.4846). (K) Graph representing the distribution of axons relative to their diameter with 0.1 µm bin width at 3 dpf in controls, csp−/− and csp−/− embryos treated with FSK (***P=0.0001 for 0.2-0.3; ***P=0.0007 for 0.4-0.5). (L) Quantification of the number of SCs within a defined region of the PLLn at 54 hpf in control (average of 73.25±3.36 cells, n=8 embryos), control treated with FSK (average of 53.23±2.89 cells, n=13 embryos), csp−/− (average of 53.68±4.28, n=6 embryos) and csp−/− treated with FSK (average of 43.46±2.65 cells, n=13 embryos). (***P=0.0005; ns, P=0.27). (M) Quantification of the number of PH3+ SCs within a defined region of the PLLn at 54 hpf in control (average of 1.37±0.46 cells, n=8 embryos), control treated with FSK (average of 0.61±0.24 cells, n=13 embryos), csp−/− (average of 6.50±0.88 cells, n=6 embryos) and csp−/− treated with FSK (average of 1.15±0.33 cells, n=13 embryos) (ns, P>0.9999; **P=0.004). (N) Quantification of the percentage of PH3+ SCs relative to the total number of SCs within a defined region of the PLLn at 54 hpf in control (average of 1.93±0.69 cells, n=8 embryos), control treated with FSK (average of 1.26±0.54 cells, n=13 embryos), csp−/− (average of 12.70±2.17 cells, n=6 embryos) and csp−/− treated with FSK (average of 3.10±1.07 cells, n=13 embryos) (ns, P>0.9999; *P=0.018). |
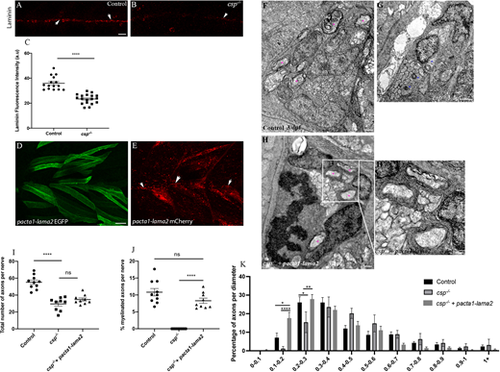
Laminin expression is significantly reduced in csp−/− and Laminin α2 overexpression rescues radial sorting and myelination defects in csp−/− embryos. (A,B) Laminin expression in control (A) and csp−/− (B) embryos at 48 hpf showing the PLLn nerve (arrows). Scale bar: 20 μm. (C) Quantification of laminin fluorescence intensity along the PLLn in controls (average of 35.95±1.39, n=15 embryos) and csp−/− (average of 23.37±0.90, n=18 embryos) embryos at 48 hpf (****P≤0.0001), a.u., arbitrary unit. (D) Lateral view of EGFP expression in muscles surrounding the PLLn following pacta1-lama2 injection. Scale bar: 20 μm. (E) Lateral view of mCherry-tagged secreted laminin in muscles and within the PLLn (white arrows). (F-H′) TEM of a cross-section of the PLLn at 3 dpf in control (F), csp−/− (G) and csp−/−+pacta1-lama2 (H) embryos. Magenta asterisks indicate some large caliber myelinated axons; some are shown at higher magnification in H′. Scale bars: 0.5 μm. (I) Quantification of the total number of axons per nerve at 3 dpf in controls (average of 55.20±2.56, ten nerves, n=6 embryos), csp−/− (average of 29.56±2.55, nine nerves, n=7 embryos) and csp−/−+pacta1-lama2 (average of 34.78±1.84, nine nerves, n=7 embryos) (****P≤0.0001; ns, P=0.1190). (J) Quantification of the percentage of myelinated axons relative to the total number of axons per nerve at 3 dpf in controls (average of 10.82±1.085), csp−/− (average of 0±0) and csp−/−+pacta1-lama2 (average of 8.28±0.77) (****P≤0.0001; ns, P=0.075). (K) Graph representing the distribution of axons relative to their diameter with 0.1 µm bin width at 3 dpf in controls, csp−/− and csp−/− injected with pacta1-lama2 (*P=0.033 for 0.1-0.2; *P=0.04 for 0.2-0.3; **P=0.005; ****P<0.0001). |
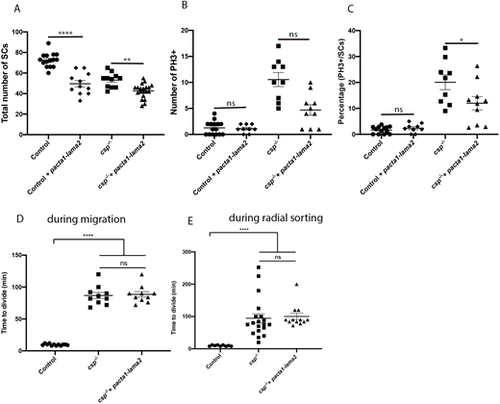
Laminin α2 overexpression reduces the number of SCs in controls and csp−/− embryos. (A) Quantification of the number of SCs within a defined region of the PLLn at 48 hpf in control (average of 72.60±1.78 cells, n=15 embryos), control injected with pacta1-lama2 (average of 49.55±3.18 cells, n=11 embryos), csp−/− (average of 53.09±2.15, n=11 embryos) and csp−/− injected with pacta1-lama2 (average of 42.60±1.56 cells, n=20 embryos) (****P<0.0001; **P=0.004). (B) Quantification of the number of PH3+ SCs within a defined region of the PLLn at 48 hpf in control (average of 1.26±0.36 cells, n=15 embryos), control injected with pacta1-lama2 (average of 1.11±0.26 cells, n=9 embryos), csp−/− (average of 10.56±1.34 cells, n=9 embryos) and csp−/− injected with pacta1-lama2 (average of 4.70±1.01 cells, n=10 embryos) (ns, P>0.9999, control versus control+pacta1-lama2; ns, P=0.28, csp−/− versus csp−/−+pacta1-lama2). (C) Quantification of the percentage of PH3+ SCs relative to the total number of SCs within a defined region of the PLLn at 48 hpf in control (average of 1.68±0.38 cells, n=13 embryos), control injected with pacta1-lama2 (average of 2.36±0.57 cells, n=9 embryos), csp−/− (average of 20.08±2.83 cells, n=9 embryos) and csp−/− injected with pacta1-lama2 (average of 11.99±2.51 cells, n=10 embryos) (ns, P>0.9999; *P=0.022). (D) Quantification of the time required for control (average of 9.66±0.39, 12 cells, n=4 embryos), csp−/− (average of 86.80±4.77, ten cells, n=4 embryos) and csp−/− injected with pacta1-lama2 (average of 88.60±4.31, ten cells, n=4 embryos) SCs to successfully complete cytokinesis during migration (****P≤0.0001; ns, P=0.7828). (E) Quantification of the time required for control (average of 9.77±0.61, nine cells, n=4 embryos), csp−/− (average of 94.42±14.18, 19 cells, n=4 embryos) and csp−/− injected with pacta-lama2 (average of 100.2±10.01, 12 cells, n=4 embryos) SCs to successfully complete cytokinesis during radial sorting (****P≤0.0001; ns, P=0.1424). |
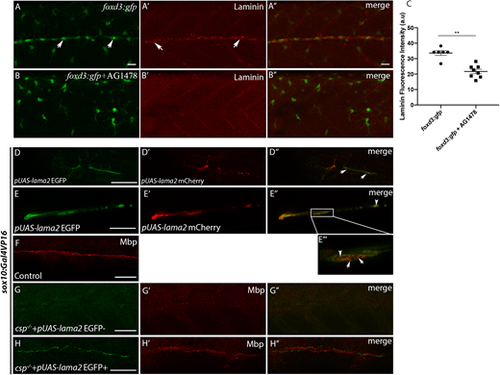
Laminin expression is significantly reduced in AG1478-treated embryos and Laminin α2 overexpression within SCs restores normal Mbp expression in csp−/− embryos. (A-B″) Laminin immunostaining in foxd3:gfp (A-A″) and foxd3:gfp embryos treated with AG1478 (B-B″) at 48 hpf. Arrows indicate GFP+ SCs in A and laminin expression along the PLLn in A′. Scale bars: 20 μm. A″ and B″ are the merge images of A and A′ and of B and B′, respectively. (C) Quantification of laminin fluorescence intensity along the PLLn in foxd3:gfp (average of 33.63±1.52, n=6 embryos) and foxd3:gfp/AG1478-treated (average of 21.67±1.44, n=8 embryos) embryos (**P=0.0013), a.u., arbitrary unit. (D,E) Lateral views of EGFP expression in SCs of the PLLn following pUAS-lama2 injection in sox10:Gal4VP16 embryos. Scale bars: 20 μm. (D′,E′) Lateral views of mCherry-tagged secreted laminin in SCs and within the PLLn. (D″,E″) Merge of D and D′ and of E and E′, respectively. mCherry-tagged secreted laminin is highlighted in E‴ at higher magnification; white arrows in D″ and E‴ indicate extracellular laminin within the PLLn and white arrowheads in E″ and E‴ indicate mCherry-tagged laminin within SCs. (F) Lateral view of Mbp immunolabeling in control embryo at 3 dpf. Scale bar: 50 μm. (G,G′) Lateral view showing the absence of EGFP expression in SCs of the PLLn (G) that correlates with a significant decrease in Mbp immunolabeling (G′) following pUAS-lama2 injection but with no EGFP/mCherry expression in csp−/−/sox10:Gal4VP16 embryos. n=24. Scale bar: 50 μm. (G″) Merge of G and G′. (H,H′) Lateral view showing EGFP expression in SCs of the PLLn that correlates with normal Mbp immunolabeling (H′) following pUAS-lama2 injection with positive clones of EGFP/mCherry in csp−/−/sox10:Gal4VP16 embryos. n=8. Scale bar: 20 μm. (H″) Merge of H and H′. |
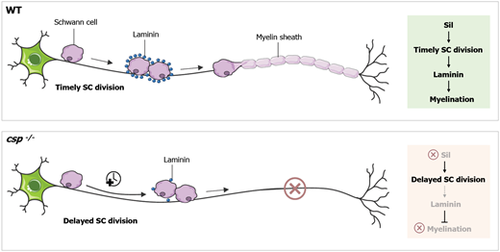
Model for sil function in SC radial sorting and myelination. The data presented here support a model in which Sil controls the timely division of SCs. Sil function is required for laminin expression in order to drive radial sorting and myelination. In the absence of Sil, laminin expression is significantly reduced, resulting in defective radial sorting and a complete loss of SC myelination. WT, wild type. |