
|
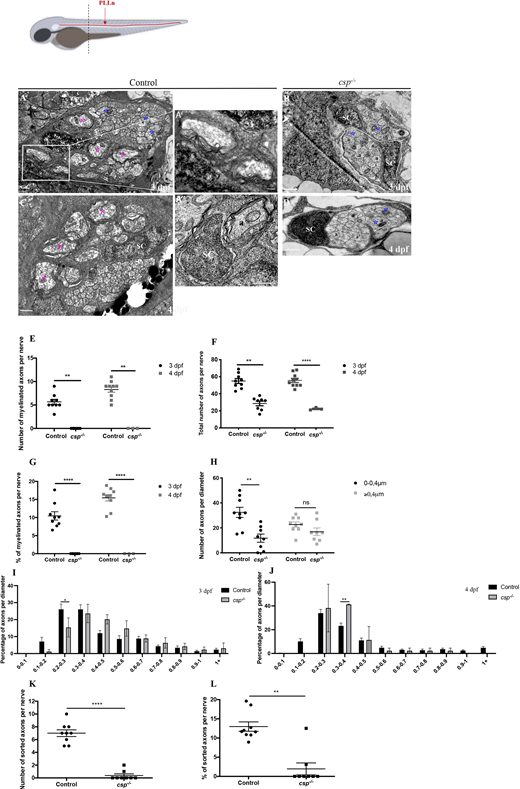
Fig. 3 Sil is essential for radial sorting and myelination by SCs. Schematic at the top shows a zebrafish larvae with PLLn shown in red. The dotted line represents the AP position of the cross-section analysis by TEM. (A-D) TEM of a cross-section of the PLLn at 3 dpf in control (A,A′) and csp−/− (B) and at 4 dpf in control (C) and csp−/− (D). Magenta asterisks highlight some large caliber myelinated axons (also shown at higher magnification in A′) and blue asterisks show some large caliber non-myelinated axons. Scale bars: 0.5 µm (A,A″,B-D); 0.2 µm (A′). (A″) Example of a 1:1 association between a SC and an axon at 3 dpf (from a different control embryo). a, axon. Axons remained bundled in csp−/− such that one SC was associated with a bundle of axons, delineated in white in B. (E) Quantification of the number of myelinated axons per nerve at 3 dpf in controls (nine nerves, n=5 embryos) and csp−/− (eight nerves, n=6 embryos) and at 4 dpf in controls (average of 8.3±0.57 myelinated axons; ten nerves, n=6 embryos) and csp−/− (zero myelinated axons; three nerves, n=3 embryos) (**P=0.0035 at 3 dpf; **P=0.005 at 4 dpf). (F) Quantification of the total number of axons per nerve at 3 dpf in controls and csp−/− and at 4 dpf in controls (54±3.16 axons) and csp−/− (23±1 axons) (**P=0.003; ****P≤0.0001). (G) Quantification of the percentage of myelinated axons relative to the total number of axons per nerve at 3 and 4 dpf in controls and csp−/− (****P≤0.0001). (H) Quantification of the number of axons relative to their diameter at 3 dpf in controls (average of 32.44 for 0-0.4 µm; average of 22.67 for >0.4 µm) and csp−/− (average of 11.75 for 0-0.4 µm; average of 16.88 for >0.4 µm) (**P=0.0013; ns, P=0.14). (I) Graph representing the distribution of axons relative to their diameter with 0.1 µm bin width at 3 dpf in controls and csp−/− embryos (*P=0.04). (J) Graph representing the distribution of axons relative to their diameter with 0.1 µm bin width at 4 dpf in controls and csp−/− embryos (**P=0.0015). (K) Quantification of the number of sorted axons per nerve at 3 dpf in control (average of 7.00±0.52) and csp−/− (0.37±0.26) embryos (****P≤0.0001). (L) Quantification of the percentage of sorted axons relative to the total number of axons at 3 dpf in control (12.97±1.21) and csp−/− (1.95±1.55) embryos (**P=0.0019).