
- Title
-
HNRNPK alleviates RNA toxicity by counteracting DNA damage in C9orf72 ALS
- Authors
- Braems, E., Bercier, V., Van Schoor, E., Heeren, K., Beckers, J., Fumagalli, L., Dedeene, L., Moisse, M., Geudens, I., Hersmus, N., Mehta, A.R., Selvaraj, B.T., Chandran, S., Ho, R., Thal, D.R., Van Damme, P., Swinnen, B., Van Den Bosch, L.
- Source
- Full text @ Acta Neuropathol.
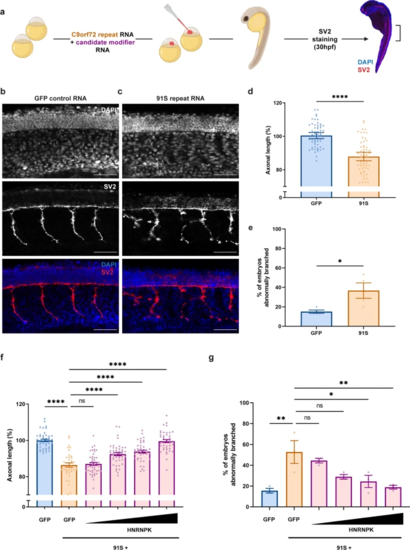
HNRNPK prevents the repeat RNA-induced axonopathy in a transient zebrafish model specific for C9orf72 RNA toxicity. a Illustration of the C9orf72 RNA toxicity zebrafish model. b, c SV2 immunostaining of motor axons in 30 hpf zebrafish embryos injected with GFP control mRNA (b) and 91 C9orf72 hexanucleotide repeats in sense direction (91S) (c). Scale bar = 50 µm. d, e Percentage of axonal length compared to control (d) and percentage of embryos with abnormal branching (e) in 30 hpf zebrafish embryos injected with GFP control and 91S repeat RNA at equimolar dose (0.844 µM) (N = 4 experiments). Data represent mean ± SEM. Statistical significance was evaluated with unpaired t test; *P < 0.05, ****P < 0.0001. f, g Effect of HNRNPK mRNA injection (0.071-0.142-0.284-0.568 µM) on the 91S repeat RNA-induced axonopathy showing a dose-dependent rescue of axonal length (f) and abnormal branching (g) (N = 3 experiments). Data represent mean ± SEM. Statistical significance was evaluated with one-way ANOVA and Tukey’s multiple comparison test; *P < 0.05, **P < 0.01, ****P < 0.0001 |
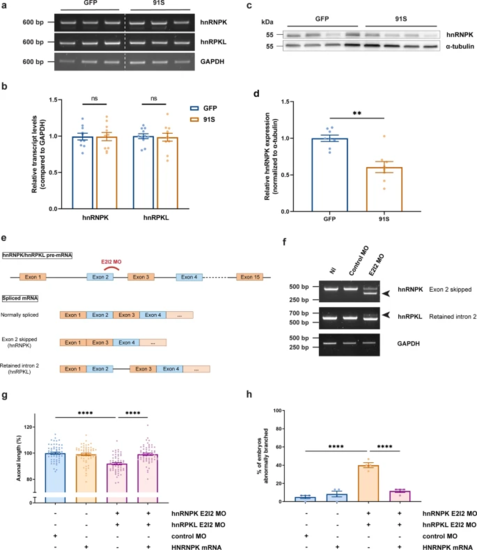
C9orf72 repeat RNA induces hnRNPK deficiency, which affects motor neuron health in zebrafish embryos. a RT-PCR analysis of HNRNPK zebrafish orthologues hnRNPK and hnRPKL in 30 hpf GFP and 91S mRNA-injected zebrafish embryos. b Relative quantification of hnRNPK and hnRPKL transcript levels in 30 hpf GFP and 91S mRNA-injected zebrafish embryos (N = 10 experiments). Data represent mean ± SEM. Statistical significance was evaluated with ratio paired t test. c Western blot detecting endogenous hnRNPK protein levels in 6 hpf GFP and 91S mRNA-injected zebrafish embryos. A-tubulin was used as a loading control. d Relative quantification of hnRNPK protein levels in 6 hpf GFP and 91S mRNA-injected zebrafish embryos, normalized to α-tubulin levels (N = 8 experiments). Data represent mean ± SEM. Statistical significance was evaluated with ratio paired t test; **P < 0.01. e Schematic presentation of splice-blocking morpholino targeting the exon 2-intron 2 (E2I2) junction in zebrafish hnRNPK and hnRPKL pre-mRNA. Outcome of the differentially spliced transcripts is shown. f Validation of MO-mediated knockdown by RT-PCR analysis. HnRNPK and hnRPKL splice variants in 30 hpf non-injected (NI), standard morpholino (control MO) and hnRNPK or hnRPKL targeting morpholino (E2I2 MO)-injected embryos are shown. Arrowheads indicate the alternative splice product induced by E2I2 splice-blocking MO. Exon 2 of hnRNPK is skipped and results in a shorter transcript. In hnRPKL, retention of intron 2 results in a higher weight band. GAPDH was used as reference gene. g, h Effect of morpholino-mediated knockdown of hnRNPK and hnRPKL on axonal length (g) and branching (h) (N = 4 experiments). E2I2 splice-blocking morpholinos were injected at 0.15 mM for hnRNPK and 0.25 mM for hnRPKL. Standard morpholino 0.25 mM. g, h Data represent mean ± SEM. Statistical significance was evaluated with Kruskal–Wallis test and Dunn’s multiple comparison test (g) or one-way ANOVA and Tukey’s multiple comparison test (h); ****P < 0.0001 |
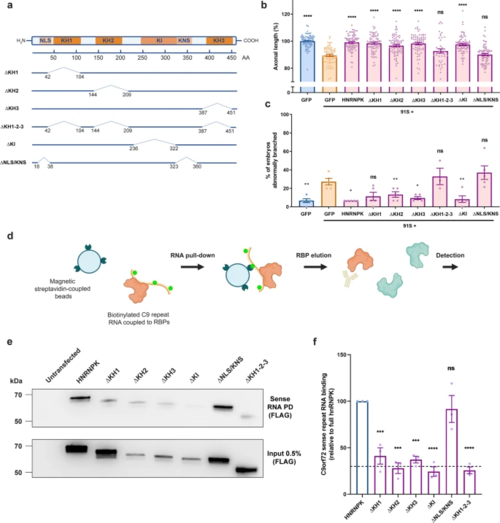
Loss of hnRNPK nuclear localization and RNA binding contributes to the axonopathy in the C9orf72 RNA toxicity zebrafish model. a Schematic model of the HNRNPK protein and its functional domains: RNA-binding domains (KH1, KH2, KH3), protein interaction domain (KI), nuclear localization signal (NLS), nuclear shuttling domain (KNS). Six deletion mutants are illustrated with numbers indicating the position of deleted amino acids (AA) from N- to C-terminus: ∆KH1, ∆KH2, ∆KH3, ∆KH1-2–3, ∆KI, ∆NLS/KNS. Each construct contains a C-terminal FLAG-tag. b, c Effect of HNRNPK deletion mutant mRNA injections at equimolar dose (0.568 µM) on the 91S (0.844 µM) repeat RNA-induced axonopathy (axonal length (b), abnormal branching (c)) compared to full-length HNRNPK mRNA injection (0.568 µM) (N = 5 experiments). Data represent mean ± SEM. Statistical significance was evaluated with one-way ANOVA and Tukey’s multiple comparison test; *P < 0.05, **P < 0.01, ****P < 0.0001. d Schematic workflow of C9orf72 repeat RNA pull-down assay. In vitro biotinylated C9orf72 repeat RNA is coupled to repeat RNA-binding proteins upon incubation with HEK cell lysate that is transfected with HNRNPK constructs. Repeat RNA–protein complexes are pulled down using magnetic streptavidin-coupled beads. Detection of bound proteins is done using Western blot. e Western blot detecting binding affinity of FLAG-tagged HNRNPK deletion mutant proteins to 91S repeat RNA using FLAG antibody (upper panel). Immunoprecipitation of HEK cells transfected with HNRNPK deletion mutants using FLAG antibody presented as 0.5% input (lower panel). f Relative quantification of binding affinity of HNRNPK deletion mutant proteins to 91S repeat RNA compared to the binding affinity of full-length HNRNPK. The dashed line represents the highest level of non-specific binding (N = 3 experiments; each data point represents the average of 2 technical replicates). Data represent mean ± SEM. Statistical significance was evaluated with one-way ANOVA and Tukey’s multiple comparison test; ***P < 0.001, ****P < 0.0001 |
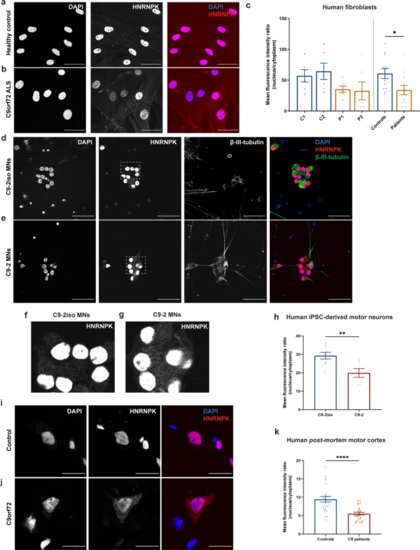
HNRNPK is mislocalized to the cytoplasm in C9orf72 ALS patient fibroblasts, iPSC-derived motor neurons and ALS patient post-mortem motor cortex. a, b Immunofluorescence of fibroblasts derived from a non-neurodegenerative control and a C9orf72 ALS patient showing localization of HNRNPK. Scale bar = 50 µm. c Quantification of nuclear and cytoplasmic HNRNPK protein levels measured as mean fluorescence intensity ratio (N = 3 experiments, 2 technical replicates). Two control fibroblast lines (C1, C2) and two patient lines (P1, P2) were quantified. Pooled control and patient data is indicated on the right side of the dotted line. d, e Immunofluorescence of mature (38 days) motor neurons derived from iPSCs from a non-neurodegenerative control and a C9orf72 ALS patient showing localization of HNRNPK. β-III-tubulin was used as a neuronal marker. Scale bar = 50 µm. f, g Close-up images from (d) and (e) showing increased cytoplasmic localization of HNRNPK in C9-2 patient line (g) compared to its isogenic control (f). h Quantification of nuclear and cytoplasmic HNRNPK protein levels measured as mean fluorescence intensity ratio (N = 4 experiments, 2 technical replicates). One patient line (C9-2) and its corresponding isogenic line (C9-2iso) were quantified. i–k Immunofluorescence of post-mortem motor cortex from a non-neurodegenerative control and a C9orf72 ALS patient showing localization of HNRNPK. Scale bar = 20 µm. k Quantification of nuclear and cytoplasmic HNRNPK protein levels measured as mean fluorescence intensity ratio in 4 non-neurodegenerative controls and 4 C9 ALS/FTD patients (N = 3 experiments, 2 technical replicates). c, h, k Data represent mean ± SEM. Statistical significance was evaluated with unpaired t test; *P < 0.05, **P < 0.01, ****P < 0.0001. Each data point represents the average N/C ratio per replicate. In total, 10 images were analyzed per experiment and per patient line or sample |
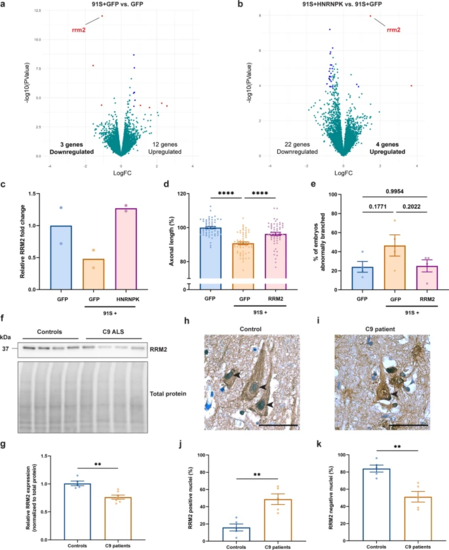
HNRNPK dysfunction induces RRM2 deficiency and nuclear translocation. a, b Volcano plots showing differentially expressed genes in 30 hpf C9 repeat RNA (91S + GFP) zebrafish embryos compared to GFP control embryos (a) and 91S + HNRNPK- compared to 91S + GFP-injected embryos (b). Significant (P < 0.0001) up- or down-regulated genes with a logFC > 1 or < − 1 and a logFC > 0.5 or < − 0.5 are indicated in red and blue respectively. Turquoise dots represent all non-significant differentially expressed genes. RRM2 transcripts are downregulated in C9 repeat RNA zebrafish embryos (a) and are upregulated upon overexpression of HNRNPK (b). c Bar graph showing the relative RRM2 fold change (N = 2 biological replicates). d, e Effect of RRM2 mRNA injection (0.314 µM) on the 91S repeat RNA-induced axonopathy on axonal length (d) and abnormal branching (e) (N = 4 experiments). Data represent mean ± SEM. Statistical significance was evaluated with one-way ANOVA and Tukey’s multiple comparison test;****P < 0.0001. P values are indicated for comparison of abnormal branching. f Western blot detecting RRM2 protein levels in post-mortem motor cortex of non-neurodegenerative controls and C9 ALS/FTD. Total protein was used to normalize data. g Relative quantification of RRM2 protein levels in 5 non-neurodegenerative controls and 7 C9 patients. Data represent mean ± SEM. Statistical significance was evaluated with unpaired t test; **P < 0.01. (h, i) Immunohistochemical detection of RRM2 in motor cortex of a representative non-neurodegenerative control (h) and a C9orf72 ALS (i) case. Arrowheads indicate nuclei of neuronal cells stained negative (h) or positive (i) for RRM2. Scale bar = 50 µm. j, k Percentage of cells containing nuclei that stain positive (j) and negative (k) for RRM2 in motor cortex of 5 non-neurodegenerative controls and 5 C9 patients. Data represent mean ± SEM. Statistical significance was evaluated with unpaired t test; **P < 0.01 |
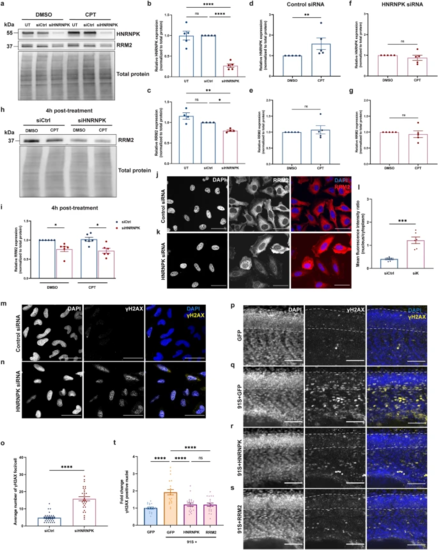
HNRNPK and RRM2 are implicated in the DNA damage response in C9 RNA toxicity. a Western blot detecting HNRNPK and RRM2 levels. The upper panel shows the confirmation of reduced HNRNPK protein levels in HeLa cells transfected with HNRNPK siRNA and treated with DMSO or 10 µM CPT. In the middle panel, RRM2 protein levels in untransfected, control siRNA (siCtrl)- and HNRNPK siRNA (siHNRNPK)-transfected cells are presented. Total protein staining was used as loading control (lower panel). b, c Quantification of HNRNPK (b) and RRM2 (c) protein levels in untransfected CPT-treated cells, or in cells transfected with siCtrl or siHNRNPK (N = 4–5 experiments). d–g Quantification of HNRNPK (d, f) and RRM2 levels (e, g) in siCtrl- (d, e) or siHNRNPK-transfected cells (f, g) treated with DMSO or CPT (N = 5 experiments). h Western blot detecting reduced RRM2 levels in siHNRNPK-transfected cells compared to cells transfected with siCtrl and collected 4 h post-treatment (upper panel). No difference is observed between DMSO- and CPT-treated cells. Total protein staining was used as loading control (lower panel). i Quantification of RRM2 protein levels (N = 6 experiments). j, k Immunostaining of RRM2 in siCtrl- (j) and siHNRNPK-transfected cells (k). l Quantification of nuclear and cytoplasmic RRM2 protein levels measured as mean fluorescence intensity ratio (N = 3 experiments, 2 technical replicates). Each data point represents the average N/C ratio per replicate. In total, 10 images were analyzed per experiment and per condition. Scale bar = 50 µm. m, n Immunostaining of γH2AX foci in siCtrl- (m) and siHNRNPK-transfected (n) HeLa cells. Scale bar = 50 µm. o Quantification of the average number of γH2AX foci per cell (N = 3 experiments). p–s Immunostaining of γH2AX foci in GFP (p), 91S + GFP (q), 91S + HNRNPK (r) and 91S + RRM2 (s) RNA-injected 30 hpf zebrafish embryos. Dotted lines indicate the borders of the spinal cord. Scale bar = 50 µm. t Quantification of the fold change of γH2AX positive nuclei in the spinal cord of zebrafish embryos (N = 3 experiments). b–g, i, l, o, t Data represent mean ± SEM. Statistical significance was evaluated with one-way ANOVA and Tukey’s multiple comparison test (b, c, t), unpaired t test (d–g, l) or Kruskal–Wallis test and Dunn’s multiple comparison test (i, o); *P < 0.05, **P < 0.01, ***P < 0.001, ****P < 0.0001 |
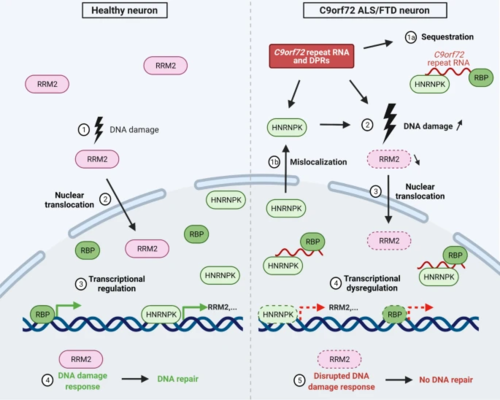
Schematic model linking mechanistic insights of HNRNPK and RRM2 in C9orf72 ALS. In the left panel, event of naturally occurring DNA damage (1) in a healthy neuron with consequential RRM2 activation and nuclear translocation (2). HNRNPK is a transcriptional regulator of RRM2 (3), essential for DNA repair in the DNA damage response (4). In the right panel, a neuron affected in C9 ALS/FTD is characterized by DPRs and RNA foci, consisting of C9orf72 repeat RNA and sequestered RNA-binding proteins, including HNRNPK (1a). Next to sequestration, HNRNPK is mislocalized to the cytoplasm (1b), resulting in a loss-of-function of HNRNPK, and directly or indirectly increasing DNA damage, which activates RRM2 (3). Loss-of-function achieves transcriptional dysregulation of downstream effectors of HNRNPK, including RRM2 (4). Activated, though depleted RRM2 results in a disrupted DNA damage response, impeding DNA repair (5). Scheme created with BioRender.com |