
Fig. 3
- ID
- ZDB-FIG-220817-31
- Publication
- Braems et al., 2022 - HNRNPK alleviates RNA toxicity by counteracting DNA damage in C9orf72 ALS
- Other Figures
- All Figure Page
- Back to All Figure Page
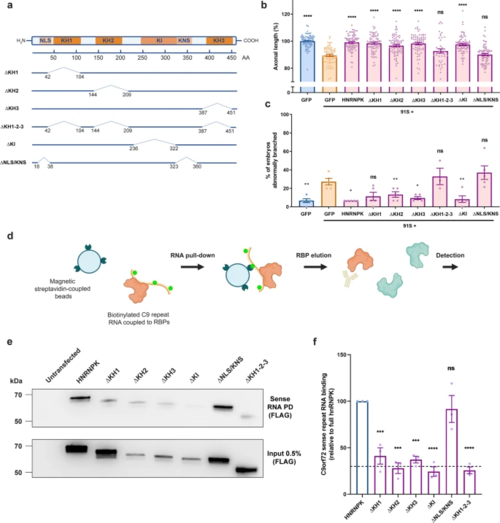
Loss of hnRNPK nuclear localization and RNA binding contributes to the axonopathy in the C9orf72 RNA toxicity zebrafish model. a Schematic model of the HNRNPK protein and its functional domains: RNA-binding domains (KH1, KH2, KH3), protein interaction domain (KI), nuclear localization signal (NLS), nuclear shuttling domain (KNS). Six deletion mutants are illustrated with numbers indicating the position of deleted amino acids (AA) from N- to C-terminus: ∆KH1, ∆KH2, ∆KH3, ∆KH1-2–3, ∆KI, ∆NLS/KNS. Each construct contains a C-terminal FLAG-tag. b, c Effect of HNRNPK deletion mutant mRNA injections at equimolar dose (0.568 µM) on the 91S (0.844 µM) repeat RNA-induced axonopathy (axonal length (b), abnormal branching (c)) compared to full-length HNRNPK mRNA injection (0.568 µM) (N = 5 experiments). Data represent mean ± SEM. Statistical significance was evaluated with one-way ANOVA and Tukey’s multiple comparison test; *P < 0.05, **P < 0.01, ****P < 0.0001. d Schematic workflow of C9orf72 repeat RNA pull-down assay. In vitro biotinylated C9orf72 repeat RNA is coupled to repeat RNA-binding proteins upon incubation with HEK cell lysate that is transfected with HNRNPK constructs. Repeat RNA–protein complexes are pulled down using magnetic streptavidin-coupled beads. Detection of bound proteins is done using Western blot. e Western blot detecting binding affinity of FLAG-tagged HNRNPK deletion mutant proteins to 91S repeat RNA using FLAG antibody (upper panel). Immunoprecipitation of HEK cells transfected with HNRNPK deletion mutants using FLAG antibody presented as 0.5% input (lower panel). f Relative quantification of binding affinity of HNRNPK deletion mutant proteins to 91S repeat RNA compared to the binding affinity of full-length HNRNPK. The dashed line represents the highest level of non-specific binding (N = 3 experiments; each data point represents the average of 2 technical replicates). Data represent mean ± SEM. Statistical significance was evaluated with one-way ANOVA and Tukey’s multiple comparison test; ***P < 0.001, ****P < 0.0001 |