
|
Fig. 5
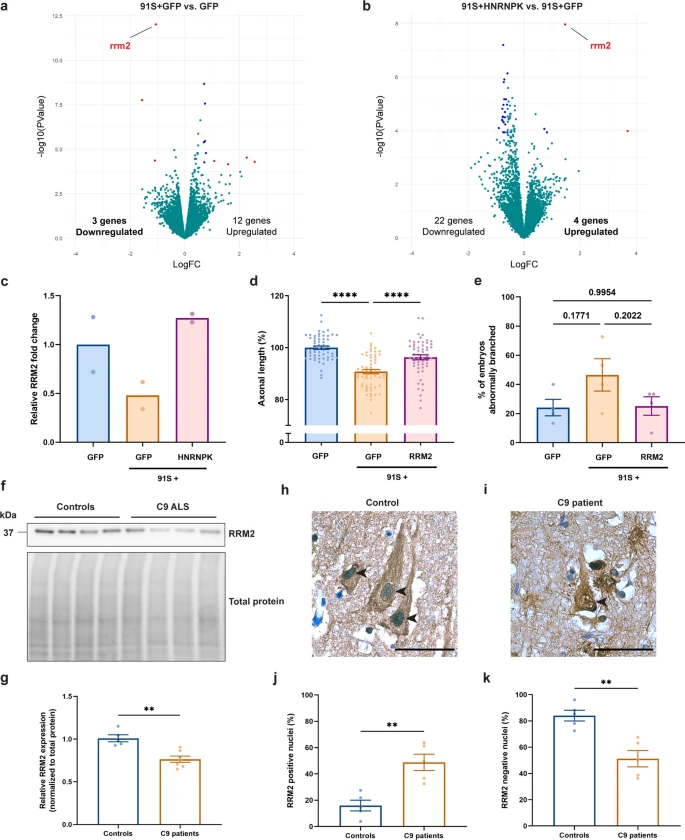
HNRNPK dysfunction induces RRM2 deficiency and nuclear translocation. a, b Volcano plots showing differentially expressed genes in 30 hpf C9 repeat RNA (91S + GFP) zebrafish embryos compared to GFP control embryos (a) and 91S + HNRNPK- compared to 91S + GFP-injected embryos (b). Significant (P < 0.0001) up- or down-regulated genes with a logFC > 1 or < − 1 and a logFC > 0.5 or < − 0.5 are indicated in red and blue respectively. Turquoise dots represent all non-significant differentially expressed genes. RRM2 transcripts are downregulated in C9 repeat RNA zebrafish embryos (a) and are upregulated upon overexpression of HNRNPK (b). c Bar graph showing the relative RRM2 fold change (N = 2 biological replicates). d, e Effect of RRM2 mRNA injection (0.314 µM) on the 91S repeat RNA-induced axonopathy on axonal length (d) and abnormal branching (e) (N = 4 experiments). Data represent mean ± SEM. Statistical significance was evaluated with one-way ANOVA and Tukey’s multiple comparison test;****P < 0.0001. P values are indicated for comparison of abnormal branching. f Western blot detecting RRM2 protein levels in post-mortem motor cortex of non-neurodegenerative controls and C9 ALS/FTD. Total protein was used to normalize data. g Relative quantification of RRM2 protein levels in 5 non-neurodegenerative controls and 7 C9 patients. Data represent mean ± SEM. Statistical significance was evaluated with unpaired t test; **P < 0.01. (h, i) Immunohistochemical detection of RRM2 in motor cortex of a representative non-neurodegenerative control (h) and a C9orf72 ALS (i) case. Arrowheads indicate nuclei of neuronal cells stained negative (h) or positive (i) for RRM2. Scale bar = 50 µm. j, k Percentage of cells containing nuclei that stain positive (j) and negative (k) for RRM2 in motor cortex of 5 non-neurodegenerative controls and 5 C9 patients. Data represent mean ± SEM. Statistical significance was evaluated with unpaired t test; **P < 0.01