FIGURE SUMMARY
Title

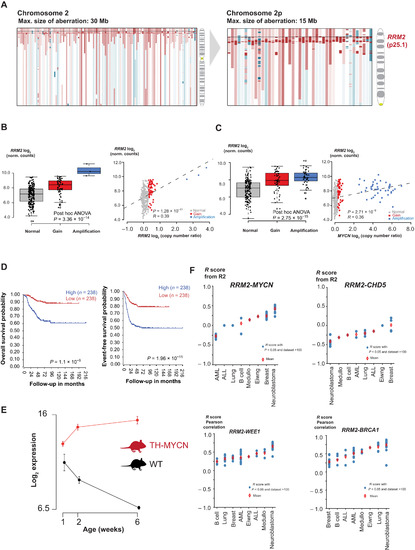
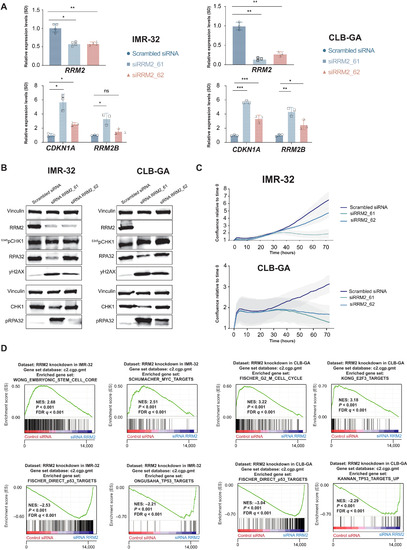
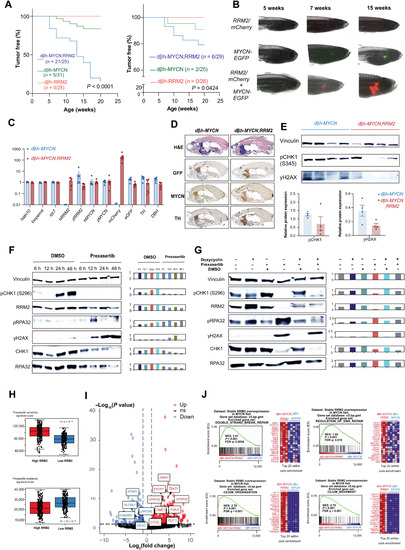
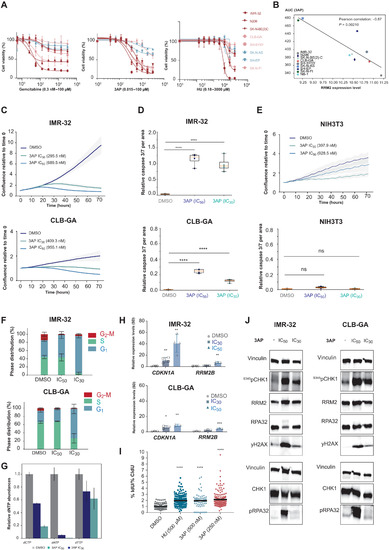
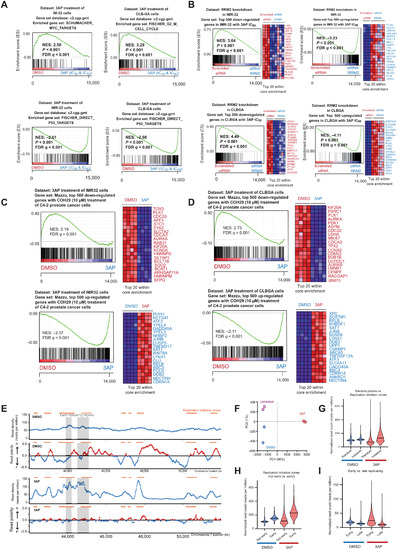
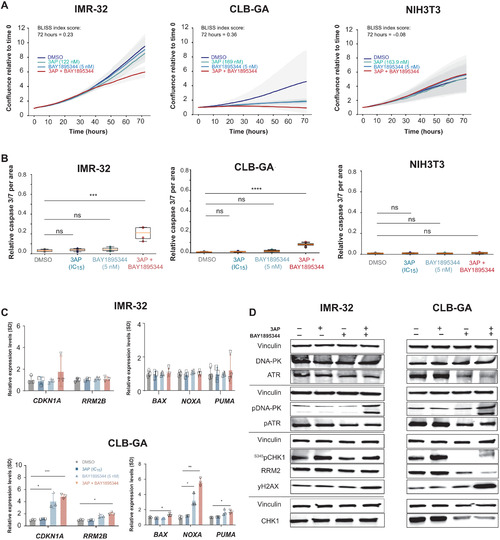
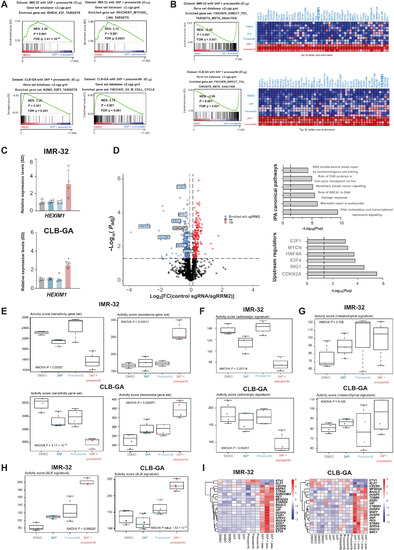
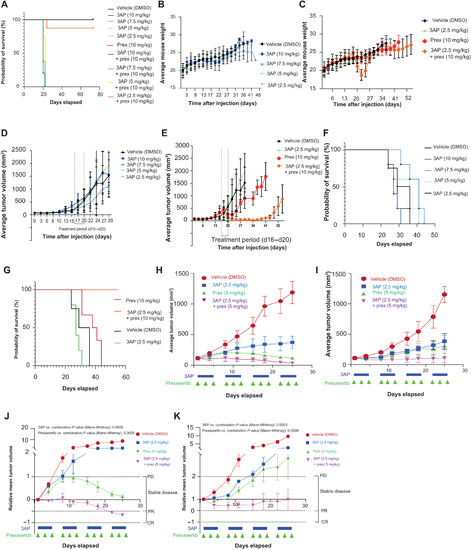
RRM2 enhances MYCN-driven neuroblastoma formation and acts as a synergistic target with CHK1 inhibition

Authors
Nunes, C., Depestel, L., Mus, L., Keller, K.M., Delhaye, L., Louwagie, A., Rishfi, M., Whale, A., Kara, N., Andrews, S.R., Dela Cruz, F., You, D., Siddiquee, A., Cologna, C.T., De Craemer, S., Dolman, E., Bartenhagen, C., De Vloed, F., Sanders, E., Eggermont, A., Bekaert, S.L., Van Loocke, W., Bek, J.W., Dewyn, G., Loontiens, S., Van Isterdael, G., Decaesteker, B., Tilleman, L., Van Nieuwerburgh, F., Vermeirssen, V., Van Neste, C., Ghesquiere, B., Goossens, S., Eyckerman, S., De Preter, K., Fischer, M., Houseley, J., Molenaar, J., De Wilde, B., Roberts, S.S., Durinck, K., Speleman, F.
Source
Full text @ Sci Adv

Fig. 1. In silico analysis of genomic and transcriptomic data of primary neuroblastoma converges toward RRM2 as a top-ranked 2p codriver in high-risk neuroblastoma.
(A) Array CGH (comparative genomic hybridization) profiles of >200 high-risk neuroblastoma cases converge toward the RRM2 gene (2p25.1) as recurrently gained on 2p (red: gained/amplified region and blue: deleted region). (B) Left: Boxplot indicating the gene dosage effect for RRM2 expression in relation to the RRM2 copy number status. Right: Correlation analysis of RRM2 expression with RRM2 copy number data [National Research Council (NRC) neuroblastoma cohort (n = 283); hgserver2.amc.nl]. ANOVA, analysis of variance. (C) Left: Boxplot indicating the gene dosage effect for RRM2 expression in relation to the MYCN copy number status. Right: Correlation analysis of RRM2 expression with MYCN copy number data [NRC neuroblastoma cohort (n = 283); hgserver2.amc.nl]. (D) High RRM2 expression levels correlate to a poor overall and event-free neuroblastoma patient survival [Kocak cohort (n = 283); hgserver2.amc.nl]. (E) Rrm2 expression is strongly up-regulated during TH-MYCN–driven neuroblastoma tumor development. (F) Pearson correlation of RRM2 and its upstream regulators (MYCN, WEE1, BRCA1, and CHD5) in expression data from various cancer entities available (hgserver2.amc.nl). AML, acute myeloid leukemia; ALL, acute lymphoblastic leukemia.

Fig. 2. Transient in vitro RRM2 knockdown in neuroblastoma cells results in an increased DNA damage and p53 pathway response, supporting its putative dependency role in neuroblastoma.
(A) Transient RRM2 knockdown in IMR-32 and CLB-GA neuroblastoma cells using two different RRM2-targeting siRNAs (denoted as si61 and si62) significantly down-regulates the expression of RRM2 and up-regulates the expression of the p53 target gene CDKN1A and the p53-inducible RRM2B gene, as shown by reverse transcription quantitative polymerase chain reaction (RT-qPCR) analysis. ns, not significant. (B) Immunblotting confirms that RRM2-targeting siRNA transfection in IMR-32 and CLB-GA cells strongly down-regulates RRM2 protein levels accompanied by DNA damage induction (increased pRPA32 and yH2AX signal) and checkpoint activation (increased pCHK1 levels) (see quantification in fig. S2). (C) IncuCyte live cell imaging analysis shows a strong reduced confluency upon siRRM2_61 transfection and, to a lesser extent, with siRRM2_62 in IMR-32 and CLB-GA cells. (D) GSEA following RNA sequencing (RNA-seq)–based transcriptome profiling of IMR-32 and CLB-GA cells transfected with RRM2-targeting siRNAs indicates a significant reduced expression of MYC targets and G2-M phase markers (top) and up-regulation of p53 target genes (bottom). FDR, false discovery rate; NES, normalized enrichment score.

Fig. 3. Combined MYCN-RRM2 overexpression in zebrafish sympathetic neuroprogenitor cells results in accelerated neuroblastoma development and increased tumor penetrance versus MYCN-only fish.
(A) Kaplan-Meier analysis of dβh-MYCN;RRM2 double transgenic zebrafish (left) and the mosaic model expressing cmlc2-eGFP/dβh-RRM2 in dβh-MYCN zebrafish (right) both show significant accelerated neuroblastoma formation and strongly increased tumor penetrance compared to dβh-MYCN fish. (B) Fluorescence microscopy images show the development of neuroblastoma tumors over time in MYCN-only (GFP) or MYCN-RRM2 double transgenic fish (mCherry). (C) RT-qPCR analysis showing human RRM2 overexpression in the dβh-MYCN;RRM2 double transgenic zebrafish compared to MYCN-only fish. Tdr7, looprn4, and hatn10 were used as housekeeping genes in this analysis. (D) H&E staining and immunofluorescent staining for the markers GFP, TH, and MYCN (×10 magnification). (E) Immunoblotting for S345pCHK1 and yH2AX for protein samples derived from MYCN and MYCN-RRM2 zebrafish. (F) Left: Time course analysis of replication stress markers in CLB-GA neuroblastoma cells upon prexasertib exposure by immunoblotting. Right: Quantification of the immunoblotting relative to vinculin. (G) Left: Time course analysis of replication stress markers in CLB-GA neuroblastoma cells before and after doxycyclin-inducible RRM2 overexpression by immunoblotting. Right: Quantification of immunoblotting relative to vinculin. (H) Signature score analysis of publicly available prexasertib sensitivity and resistance gene signatures in a large primary cohort of neuroblastoma cases (GSE62564). (I) Volcano plot showing the set of significantly up-regulated (red) and down-regulated (blue) genes in dβh-MYCN;RRM2 double transgenic versus dβh-MYCN fish. (J) GSEA of the gene expression profiles using the C5 curated MSigDB gene sets of dβh-MYCN;RRM2 double transgenic versus dβh-MYCN fish shows a significant up-regulation of DNA repair and genes related to cilium organization and movement, while down-regulated gene sets were predominantly related to synapse transmission gene sets [see volcano plot in (I) (blue)].

Fig. 4. Comparative RNR inhibitor analysis to kill neuroblastoma cells.
(A) 3AP treatment can establish lower half-maximal inhibitory concentrations than gemcitabine and HU in a panel of neuroblastoma cell lines, with MYCN-amplified cell lines and the nonamplified CLB-GA cell line being more sensitive than MYCN-nonamplified cell lines (red: MYCN amplified, adrenergic; orange: MYCN nonamplified, adrenergic; blue: MYCN nonamplified, mesenchymal). (B) 3AP sensitivity (AUC) is negatively correlated to RRM2 mRNA expression levels in a panel of neuroblastoma cell lines. (C) Treatment of IMR-32 and CLB-GA neuroblastoma cells with 3AP at their respective half-maximal inhibitory concentration significantly reduces cell confluence and (D) induces cell death. (E) Nonmalignant murine NIH3T3 fibroblasts did not show reduced confluence or apoptosis induction upon 3AP exposure. (F) IC30 values for IMR-32 and CLB-GA neuroblastoma cells impose a significant S phase cell cycle arrest. (G) Endogenous dNTP pools are reduced upon exposure of IMR-32 neuroblastoma cells to 3AP. (H) 3AP (IC50) treatment leads to a significant increased CDKN1A and RRM2B expression. (I) DNA combing following exposure of IMR-32 neuroblastoma cells to HU or 3AP shows a significant increased levels of stalled forks upon 3AP treatment versus controls. IdU, 5′-iododeoxyuridine. (J) Immunoblotting for DNA damage response markers (pRPA32 and yH2A) and CHK1/S345pCHK1 in protein extracts of neuroblastoma cells treated with fixed IC30 and IC50 of 3AP (for quantification, see fig. S2). CIdU, 5-chloro-2’-deoxyuridine.

Fig. 5. 3AP leads to dormant origin activation following replication fork stalling at early firing origins, as measured by transferase-activated end ligation sequencing.
(A) GSEA of RNA-seq–based transcriptome profiling using the C2 curated MSigDB gene sets for 3AP-treated IMR-32 and CLB-GA neuroblastoma cells. (B) GSEA shows a strongly significant overlap between up- and down-regulated gene signatures upon RRM2 knockdown and 3AP (IC50) treatment of IMR-32 and CLB-GA neuroblastoma cells. (C) GSEA shows a significant enrichment of publicly available transcriptome profiles of C4-2 prostate cancer cells upon exposure with the RRM2 inhibitor COH29 (10 μM) in the transcriptomes of IMR-32 neuroblastoma cells treated with the RRM2 inhibitor 3AP. (D) GSEA shows a significant enrichment of publicly available transcriptome profiles of C4-2 prostate cancer cells upon exposure with the RRM2 inhibitor COH29 (10 μM) in the transcriptomes of CLB-GA neuroblastoma cells treated with the RRM2 inhibitor 3AP. (E) TrAEL-seq read density and read polarity plots for IMR-32 cells treated for 24 hours with 3AP IC50 or DMSO alone. Read polarity was quantified by (RF)/(R + F); data shown is an average of two biological replicates. Orange bars represent regions replication IZs called from DMSO-only control samples, and gray boxes represent early replicating regions based on published Repli-Seq data (56). (F) PCA for the TrAEL-seq libraries. (G to I) Violin plots of TrAEL-seq read count distributions (corrected for probe length) from DMSO- and 3AP-treated IMR-32 cells and solid and dotted lines denote median, upper quartile, and lower quartile, respectively. (G) Comparison of replication IZs to a set of 8760 random regions of equivalent average size. (H) Comparison of replication IZs that do or do not overlap with early replicating regions [defined in (E)]. (I) Read counts for early versus late replicating genomic regions defined on the basis of Repli-Seq data (56).

Fig. 6. Phenotypic effects of combined RRM2-ATR pharmacological inhibition are opposed through the activation of a DNA-PK salvage pathway.
(A) IncuCyte live cell imaging indicates a drug synergism between RRM2 and the ATR inhibitor BAY1895543 that could not be shown in normal fibroblast cells (NIH3T3). (B) Combined RRM2-ATR inhibition leads to a significant induction of apoptosis compared to control or single compound–treated neuroblastoma cells while leaving NIH3T3 cells unaffected. (C) RT-qPCR analysis for CDKN1A, RRM2B, NOXA, PUMA, and BAX in IMR-32 and CLB-GA neuroblastoma cells following control (DMSO), single (3AP or BAY1895543), or combined (3AP and BAY1895543) drug treatment. (D) Immunoblotting for various DNA damage markers in IMR-32 and CLB-GA cells upon treatment with DMSO, 3AP, or BAY1895344 as a single agent or combined treatment of 3AP with BAY1895344.

Fig. 7. Identification of 3AP-prexasertib as a synergistic drug combination in neuroblastoma.
(A) IncuCyte live cell imaging indicates a drug synergism between RRM2 and CHK1 pharmacological inhibition resulting in reduced cell confluence in IMR-32 and CLB-GA neuroblastoma cells, while not affecting NIH3T3 confluence. (B) Combined 3AP-prexasertib treatment of IMR-32 and CLB-GA neuroblastoma cells leads to a significant induction of apoptosis compared to a single compound treatment or DMSO-treated cells, while NIH3T3 cells did not show any apoptotic response. (C) Combined 3AP-prexasertib treatment of IMR-32 and CLB-GA neuroblastoma cells results in a strong S phase arrest compared to a single compound treatment or DMSO-treated cells. (D) RT-qPCR analysis for the p53 targets CDKN1A and RRM2B as well as the proapoptotic genes BAX, NOXA, and PUMA upon combined 3AP-prexasertib treatment. (E) Immunoblotting for various DNA damage markers in IMR-32 and CLB-GA cells upon treatment with DMSO or 3AP or prexasertib as a single agent or combined 3AP and prexasertib (see quantification in fig. S2). (F) 3AP-prexasertib combined treatment synergistically affected neuroblastoma spheroid cell viability 120 hours after treatment.

Fig. 8. Scrutinizing putative RRM2 upstream regulators by CasID.
(A) GSEA of transcriptome data generated following combined 3AP-prexasertib treatment of IMR-32 and CLB-GA neuroblastoma cells shows significantly reduced expression of E2F and G2-M cell cycle–controlled genes compared to control (DMSO)– or single compound–treated cells. (B) GSEA of transcriptome data generated following combined 3AP-prexasertib treatment of IMR-32 and CLB-GA neuroblastoma cells shows significantly up-regulated expression of p53 target genes compared to control (DMSO)– or single compound–treated cells. (C) RT-qPCR confirms significantly up-regulated HEXIM1 expression upon combined 3AP and prexasertib treatment compared to control treatment (DMSO). (D) Left: Volcano plot of significantly enriched hits from a proximity-based and biotin-dependent CasID approach for the identification of RRM2 upstream regulatory factors in SK-N-BE(2)-C cells (FDR < 0.05). Right: Ingenuity Pathway Analysis (IPA) for the identification of enriched pathways and putative upstream regulators of the putative RRM2 regulators as identified by CasID (overview of all hits can be found in table S1). (E) Boxplots depicting the activity score in IMR-32 and CLB-GA cells of a prexasertib “sensitivity” (left) and “resistance” (right) gene signature as defined in neuroblastoma patient-derived xenografts (PDX) (65). (F) Boxplots depicting the activity score in IMR-32 and CLB-GA cells of an adrenergic gene signature (66). (G) Boxplots depicting the activity score in IMR-32 and CLB-GA cells of a mesenchymal gene signature (66). (H) Boxplots depicting the activity score in IMR-32 and CLB-GA cells of an ALK signaling signature (67). (I) Heatmaps depicting the significantly differentially expressed genes of the ALK signaling signature as scored in (H).

Fig. 9. In vivo validation of 3AP-prexasertib synergism.
(A) Survival probabilities were measured over time of control-treated, 3AP single compound–treated, and prexasertib-treated mice and mice treated with different concentration combinations of 3AP and prexasertib. Statistical analyses were performed using the log-rank (Mantel-Cox) test. (B) Time course analysis of the average mouse weight per 3AP treatment group included in this murine cell line xenograft study. (C) Time course analysis of the average mouse weight per 3AP, prexasertib, and combination treatment groups included in this murine cell line xenograft study. (D) Average tumor volume (TV) of the different 3AP treatment groups included in this murine cell line xenograft study. (E) Average TV of the 3AP, prexasertib, or combination treatment group included in this murine cell line xenograft study. (F) Time course analysis of the survival probabilities of the different 3AP treatment groups included in this murine cell line xenograft study. (G) Time course analysis of the survival probabilities of the 3AP, prexassertib, and combination treatment group included in the experiment. (H) Average TV of the 3AP, prexasertib, or combination treatment group included for the treatment schedule of a MYNC-nonamplified (p53 wild type) neuroblastoma PDX model. (I) Average TV of the 3AP, prexasertib, or combination treatment group included for the treatment schedule of a MYNC-amplified (p53 wild type, ALK R1275Q mutant) neuroblastoma PDX model. (J) Relative mean TV of the 3AP, prexasertib, or combination treatment group included for the treatment schedule of a MYNC-nonamplified (p53 wild type) neuroblastoma PDX model. (K) Relative mean TV of the 3AP, prexasertib, or combination treatment group included for the treatment schedule of a MYNC-amplified (p53 wild type, ALK R1275Q mutant) neuroblastoma PDX model. CR, complete response; PR, partial response; PD, progressive disease.

Acknowledgments
This image is the copyrighted work of the attributed author or publisher, and ZFIN has permission only to display this image to its users. Additional permissions should be obtained from the applicable author or publisher of the image. Full text @ Sci Adv