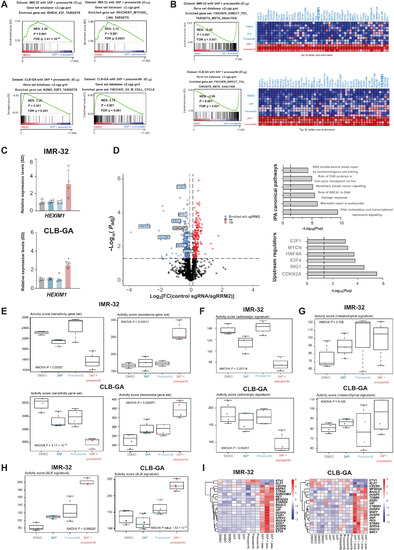
(A) GSEA of transcriptome data generated following combined 3AP-prexasertib treatment of IMR-32 and CLB-GA neuroblastoma cells shows significantly reduced expression of E2F and G2-M cell cycle–controlled genes compared to control (DMSO)– or single compound–treated cells. (B) GSEA of transcriptome data generated following combined 3AP-prexasertib treatment of IMR-32 and CLB-GA neuroblastoma cells shows significantly up-regulated expression of p53 target genes compared to control (DMSO)– or single compound–treated cells. (C) RT-qPCR confirms significantly up-regulated HEXIM1 expression upon combined 3AP and prexasertib treatment compared to control treatment (DMSO). (D) Left: Volcano plot of significantly enriched hits from a proximity-based and biotin-dependent CasID approach for the identification of RRM2 upstream regulatory factors in SK-N-BE(2)-C cells (FDR < 0.05). Right: Ingenuity Pathway Analysis (IPA) for the identification of enriched pathways and putative upstream regulators of the putative RRM2 regulators as identified by CasID (overview of all hits can be found in table S1). (E) Boxplots depicting the activity score in IMR-32 and CLB-GA cells of a prexasertib “sensitivity” (left) and “resistance” (right) gene signature as defined in neuroblastoma patient-derived xenografts (PDX) (65). (F) Boxplots depicting the activity score in IMR-32 and CLB-GA cells of an adrenergic gene signature (66). (G) Boxplots depicting the activity score in IMR-32 and CLB-GA cells of a mesenchymal gene signature (66). (H) Boxplots depicting the activity score in IMR-32 and CLB-GA cells of an ALK signaling signature (67). (I) Heatmaps depicting the significantly differentially expressed genes of the ALK signaling signature as scored in (H).