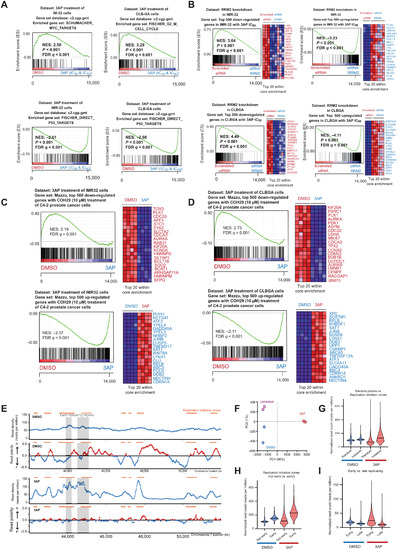
Fig. 5. 3AP leads to dormant origin activation following replication fork stalling at early firing origins, as measured by transferase-activated end ligation sequencing. (A) GSEA of RNA-seq–based transcriptome profiling using the C2 curated MSigDB gene sets for 3AP-treated IMR-32 and CLB-GA neuroblastoma cells. (B) GSEA shows a strongly significant overlap between up- and down-regulated gene signatures upon RRM2 knockdown and 3AP (IC50) treatment of IMR-32 and CLB-GA neuroblastoma cells. (C) GSEA shows a significant enrichment of publicly available transcriptome profiles of C4-2 prostate cancer cells upon exposure with the RRM2 inhibitor COH29 (10 μM) in the transcriptomes of IMR-32 neuroblastoma cells treated with the RRM2 inhibitor 3AP. (D) GSEA shows a significant enrichment of publicly available transcriptome profiles of C4-2 prostate cancer cells upon exposure with the RRM2 inhibitor COH29 (10 μM) in the transcriptomes of CLB-GA neuroblastoma cells treated with the RRM2 inhibitor 3AP. (E) TrAEL-seq read density and read polarity plots for IMR-32 cells treated for 24 hours with 3AP IC50 or DMSO alone. Read polarity was quantified by (R − F)/(R + F); data shown is an average of two biological replicates. Orange bars represent regions replication IZs called from DMSO-only control samples, and gray boxes represent early replicating regions based on published Repli-Seq data (56). (F) PCA for the TrAEL-seq libraries. (G to I) Violin plots of TrAEL-seq read count distributions (corrected for probe length) from DMSO- and 3AP-treated IMR-32 cells and solid and dotted lines denote median, upper quartile, and lower quartile, respectively. (G) Comparison of replication IZs to a set of 8760 random regions of equivalent average size. (H) Comparison of replication IZs that do or do not overlap with early replicating regions [defined in (E)]. (I) Read counts for early versus late replicating genomic regions defined on the basis of Repli-Seq data (56).
|
