
FIGURE SUMMARY
- Title
-
Biallelic variants in WARS1 cause a highly variable neurodevelopmental syndrome and implicate a critical exon for normal auditory function
- Authors
- Lin, S.J., Vona, B., Porter, H.M., Izadi, M., Huang, K., Lacassie, Y., Rosenfeld, J.A., Khan, S., Petree, C., Ali, T.A., Muhammad, N., Khan, S.A., Muhammad, N., Liu, P., Haymon, M.L., Rüschendorf, F., Kong, I.K., Schnapp, L., Shur, N., Chorich, L., Layman, L., Haaf, T., Pourkarimi, E., Kim, H.G., Varshney, G.K.
- Source
- Full text @ Hum. Mutat.
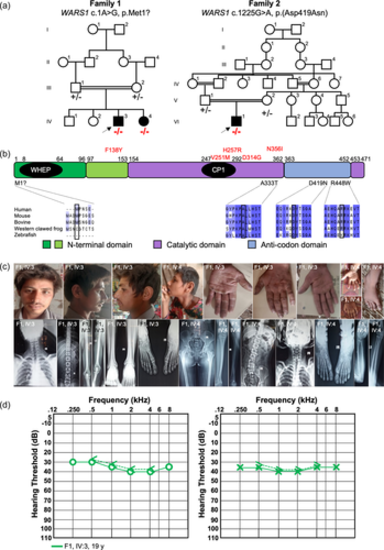
Pedigree, variant segregation, alignment of WARS1 orthologues with respect to protein domain structures, and clinical information. (a) Pedigrees of Families 1 (left) and 2 showing (right) segregation of the respective variant listed above each pedigree. Mutant alleles are represented with “−” and the reference allele is shown with “+.” (b) Alignment of multiple WARS1 orthologues with amino acid substitutions involved in autosomal recessive (shown below the protein domain schematic) and autosomal dominant (shown above in red) illustrating amino acid conservation of the involved amino acid (boxed in black) and flanking region (autosomal recessively-associated alleles only). The domain diagram of human WARS1 shows the domain structures. CP1, connective polypeptide; WHEP, helix-turn-helix motif. (c) Facial features of the two affected individuals in Family 1 (IV:3 and IV:4) showing triangular face with micrognathia, and abundant hair and eyebrows, and large earlobes with apparent bifid tragus. Hands are small with round fingernails and show clinodactyly of the fifth finger, variation of deep palmar flexion creases, and presence of hypothenar creases. Radiology studies show mild medullary widening and minimal medial bowing of the mid/distal fibula shafts. Most severe, shown in IV:4, is coxa valga with deformity of the hips. (d) Pure-tone audiograms from the proband in Family 1 at the age of 19 years show mild, bilateral, sensorineural hearing loss. Right air conduction (circles), unmasked bone conduction (<), left air conduction (crosses) and unmasked bone conduction (>) are shown.
|
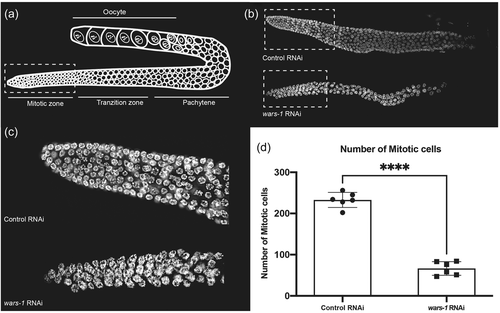
Defect in mitosis cell division in Caenorhabditis elegans germline upon WARS-1 depletion. (a) Schematic representation of hermaphrodite germline. (b) DAPI staining of the isolated germline of the control and wars-1 RNAi. The dashed box indicates the mitotically active region of the germline. (c) Zoom-in of the mitotic zone of control and wars-1 RNAi (d) Knocking down wars-1 using RNAi results in a reduction in the number of mitotic cells compared to the control. (n = 6, ****p < .0001). DAPI, 4′,6-diamidino-2-phenylindole; RNAi, RNA interference.
|

wars1 messenger RNA (mRNA) is predominantly expressed in the zebrafish eye, brain, and muscle in the embryo and wars1 F0 mutants display gross morphological defects. (a) The wars1 mRNA expression in the 1 dpf embryo. Dorsal view, anterior to the left. (b) wars1 knockouts are generated by CRISPR/Cas9. Uninjected control, wars1 F0 mutant and wars1 F0 mutant rescued with wild-type WARS1 mRNA (rescue) embryo at 3 dpf. Blue line indicates the brain size. Red line indicates the eye size. Black arrow indicates heart edema. Lateral view, anterior to the left. (c) Quantification of eye and head size from uninjected controls, wars1 F0, wars1 F0 + 150 or 200 picogram (pg) of zebrafish wild-type wars1 mRNA (+wars1), and wars1 F0 + 150 or 200 pg of human wild-type WARS1 mRNA (+WARS1). Each group contains 30 embryos, and each dot represents one embryo. Error bar = mean ± SD. One-way analysis of variance (ANOVA) with Tukey's multiple comparisons test: ns, not significant p ≥ 0.05, **p < 0.01, ***p < 0.001, and ****p < 0.0001. All marked groups were compared to wars1 F0 mutant embryos. (d, e) Histological analysis of uninjected control, wars1 F0 mutant, and wars1 F0 mutant rescued with human wild-type WARS1 mRNA (rescue) larva at 5 dpf by cross-section (d) and sagittal section (e). Red asterisk indicates loss of cell density. Red arrow indicates the shorter lower jaw. Forebrain (fb), midbrain (mb), midbrain and hindbrain boundary (MHB), hindbrain (hb), optic tectum (TeO), otic vesicle (ov), retinal pigment epithelium (RPE), outer nuclear layer (ONL), inner nuclear layer (INL), inner plexiform layer (IPL), ganglion cell layer (GCL), tectum (tc), telencephalon (Tel), and cerebellum (ce).
EXPRESSION / LABELING:
PHENOTYPE:
|
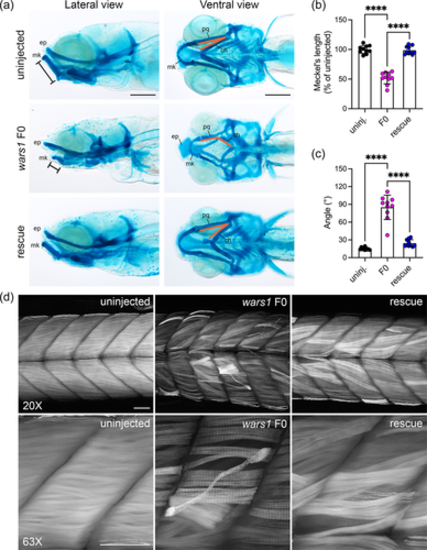
Zebrafish wars1 F0 mutants displayed craniofacial dysmorphism and skeletal muscle myopathy. (a) Alcian blue staining was performed to reveal the craniofacial cartilage structure of uninjected control, wars1 F0, and rescue larvae at 8 dpf. Ethmoid plate (ep), Meckel's cartilage (Mk), palatoquadrate (pq), and ceratohyal (ch). Scale bar = 200 μm. (b) Quantification of the length of Meckel's cartilage measurement as indicated in control, F0 mutants, and mutants with WARS1 mRNA rescue. (c) Quantification of alignment of palatoquadrate and ceratohyal cartilage in controls, F0 mutants, and mutants with WARS1 mRNA rescue. (d) Analysis of muscle development using phalloidin stain that labels actin filaments. 8 dpf old uninjected control embryos showing well-developed actin fibers (left panel), wars1 F0 mutants showing disorganized actin fibers (middle panel), and wars1 mutant phenotypes rescued the phenotype with human WARS1 mRNA (right panel). Scale bar = 50 μm. mRNA, messenger RNA. For (b, c), each group contains 10 larvae and each dot represents one larvae. Error bar = mean ± SD. One-way ANOVA with Tukey's multiple comparisons test: ****p < 0.0001. All marked groups were compared to F0.
PHENOTYPE:
|
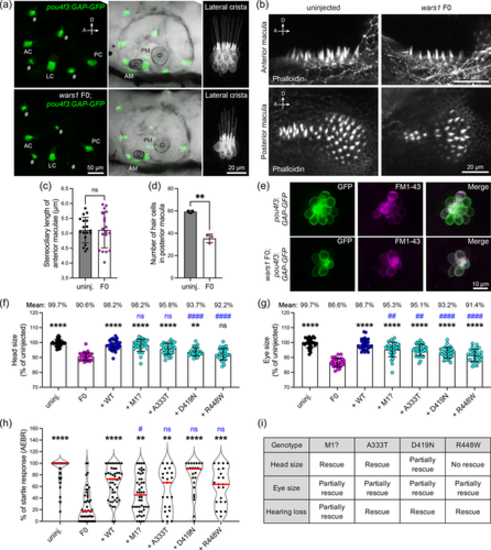
Analysis of hearing phenotypes in zebrafish wars1 F0 mutants, and functional validation of WARS1 variants. (a) Confocal analysis of sensory epithelia in wars1 F0 mutants in the transgenic line, Tg(pou4f3:GAP-GFP) that labels hair cells. Top panel shows uninjected controls and bottom panel shows wars1 F0 mutants at 5 dpf. Detailed analysis of hair cells in lateral cristae shows well developed (AC, anterior crista; AM, anterior macula; LC, lateral crista; PC, posterior crista; PM, posterior macula; #, hair cells of neuromast). (b) Confocal analysis of hair bundles by phalloidin staining in the anterior and posterior macula. Phalloidin staining show highly organized hair bundles both in uninjected controls and F0 mutant larvae. (c) Quantification of stereociliary length of the anterior macula shows normal development in wars1 F0 mutants similar to uninjected controls. Each dot represents one stereocilia. n = 18 stereocilia (d) Quantification of hair cell development shows fewer hair cells. n = 3 maculae. (e) Confocal analysis of hair cells development and function in the sensory lateral line. GFP labeled (green), and FM1-43 dye labeled (magenta) hair cells in uninjected controls (top panel), and wars1 F0 mutants (bottom panel) showing a reduced number of hair cells and FM1-43 dye uptake. (f, g) Quantification of head and eye size in the uninjected control, wars1 F0 and F0 rescued with human wild-type or different variants as labeled on the figure. n = 30 embryos for each group. (h) The auditory evoked behavior response (AEBR) analysis of larvae rescued with different human variants. Each dot represents one larva. (i) Summary the rescue results from (f–h). No rescue: Mean value of the group is close to the mean of F0 group, and the statistic shows no significance compared to F0. Partially rescued: Mean value of the group is higher than the mean of F0 group but lower than the mean of WT rescue group, and statistical difference shows significance compared to F0 but also shows significance compared to WT rescue. Rescue: Mean value of the group is close to WT rescue and the statistical difference shows no significance compared to WT rescue. In (c, d), p values were calculated by two-tailed unpaired Student's t test with Welch's correction. In (f–h), p values were calculated by one-way ANOVA with Tukey's multiple comparisons test. ns, not significant p ≥ 0.05, **p < 0.01, ***p < 0.001, and ****p < 0.0001 were compared to wars1 F0 mutant animals. ##p < 0.01 and ####p < 0.0001 were compared to WT rescue group.
|
Acknowledgments
This image is the copyrighted work of the attributed author or publisher, and
ZFIN has permission only to display this image to its users.
Additional permissions should be obtained from the applicable author or publisher of the image.
Full text @ Hum. Mutat.