
FIGURE
Fig. 5
- ID
- ZDB-FIG-220905-11
- Publication
- Lin et al., 2022 - Biallelic variants in WARS1 cause a highly variable neurodevelopmental syndrome and implicate a critical exon for normal auditory function
- Other Figures
- All Figure Page
- Back to All Figure Page
Fig. 5
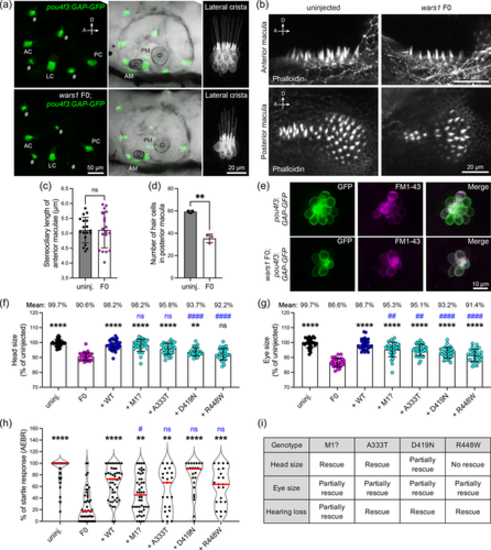
Analysis of hearing phenotypes in zebrafish wars1 F0 mutants, and functional validation of WARS1 variants. (a) Confocal analysis of sensory epithelia in wars1 F0 mutants in the transgenic line, Tg(pou4f3:GAP-GFP) that labels hair cells. Top panel shows uninjected controls and bottom panel shows wars1 F0 mutants at 5 dpf. Detailed analysis of hair cells in lateral cristae shows well developed (AC, anterior crista; AM, anterior macula; LC, lateral crista; PC, posterior crista; PM, posterior macula; #, hair cells of neuromast). (b) Confocal analysis of hair bundles by phalloidin staining in the anterior and posterior macula. Phalloidin staining show highly organized hair bundles both in uninjected controls and F0 mutant larvae. (c) Quantification of stereociliary length of the anterior macula shows normal development in wars1 F0 mutants similar to uninjected controls. Each dot represents one stereocilia. n = 18 stereocilia (d) Quantification of hair cell development shows fewer hair cells. n = 3 maculae. (e) Confocal analysis of hair cells development and function in the sensory lateral line. GFP labeled (green), and FM1-43 dye labeled (magenta) hair cells in uninjected controls (top panel), and wars1 F0 mutants (bottom panel) showing a reduced number of hair cells and FM1-43 dye uptake. (f, g) Quantification of head and eye size in the uninjected control, wars1 F0 and F0 rescued with human wild-type or different variants as labeled on the figure. n = 30 embryos for each group. (h) The auditory evoked behavior response (AEBR) analysis of larvae rescued with different human variants. Each dot represents one larva. (i) Summary the rescue results from (f–h). No rescue: Mean value of the group is close to the mean of F0 group, and the statistic shows no significance compared to F0. Partially rescued: Mean value of the group is higher than the mean of F0 group but lower than the mean of WT rescue group, and statistical difference shows significance compared to F0 but also shows significance compared to WT rescue. Rescue: Mean value of the group is close to WT rescue and the statistical difference shows no significance compared to WT rescue. In (c, d), p values were calculated by two-tailed unpaired Student's t test with Welch's correction. In (f–h), p values were calculated by one-way ANOVA with Tukey's multiple comparisons test. ns, not significant p ≥ 0.05, **p < 0.01, ***p < 0.001, and ****p < 0.0001 were compared to wars1 F0 mutant animals. ##p < 0.01 and ####p < 0.0001 were compared to WT rescue group.
|
Expression Data
Expression Detail
Antibody Labeling
Phenotype Data
| Fish: | |
|---|---|
| Knockdown Reagents: | |
| Observed In: | |
| Stage Range: | Day 5 to Day 6 |
Phenotype Detail
Acknowledgments
This image is the copyrighted work of the attributed author or publisher, and
ZFIN has permission only to display this image to its users.
Additional permissions should be obtained from the applicable author or publisher of the image.
Full text @ Hum. Mutat.