
Image
|
Figure Caption
Fig. 4
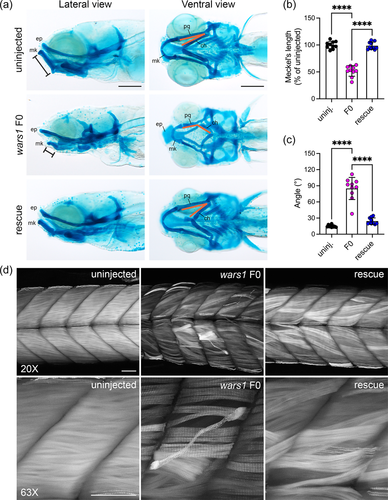
Zebrafish wars1 F0 mutants displayed craniofacial dysmorphism and skeletal muscle myopathy. (a) Alcian blue staining was performed to reveal the craniofacial cartilage structure of uninjected control, wars1 F0, and rescue larvae at 8 dpf. Ethmoid plate (ep), Meckel's cartilage (Mk), palatoquadrate (pq), and ceratohyal (ch). Scale bar = 200 μm. (b) Quantification of the length of Meckel's cartilage measurement as indicated in control, F0 mutants, and mutants with WARS1 mRNA rescue. (c) Quantification of alignment of palatoquadrate and ceratohyal cartilage in controls, F0 mutants, and mutants with WARS1 mRNA rescue. (d) Analysis of muscle development using phalloidin stain that labels actin filaments. 8 dpf old uninjected control embryos showing well-developed actin fibers (left panel), wars1 F0 mutants showing disorganized actin fibers (middle panel), and wars1 mutant phenotypes rescued the phenotype with human WARS1 mRNA (right panel). Scale bar = 50 μm. mRNA, messenger RNA. For (b, c), each group contains 10 larvae and each dot represents one larvae. Error bar = mean ± SD. One-way ANOVA with Tukey's multiple comparisons test: ****p < 0.0001. All marked groups were compared to F0.
Figure Data
Acknowledgments
This image is the copyrighted work of the attributed author or publisher, and
ZFIN has permission only to display this image to its users.
Additional permissions should be obtained from the applicable author or publisher of the image.
Full text @ Hum. Mutat.