
- Title
-
Salviae miltiorrhizae Liguspyragine Hydrochloride and Glucose Injection Protects against Myocardial Ischemia-Reperfusion Injury and Heart Failure
- Authors
- Kong, S., Zhou, D., Fan, Q., Zhao, T., Ren, C., Nie, H.
- Source
- Full text @ Comput. Math. Methods Med.

ZFIN is incorporating published figure images and captions as part of an ongoing project. Figures from some publications have not yet been curated, or are not available for display because of copyright restrictions. PHENOTYPE:
|
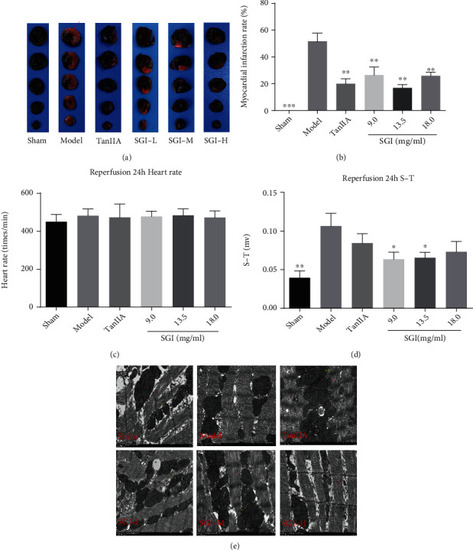
The protective effect of SGI on MIR in rats. (a, b) Dark blue represents normal myocardial tissue, and red represents infarcted myocardium. (c) The effect of SGI on heart rate. (d) The effect of SGI on the S-T segment. (e) Myocardial microstructure by transmission electron microscopy, red arrows represent myocardial fibers and yellow arrows represent mitochondria. Compared with the model group, ∗ |
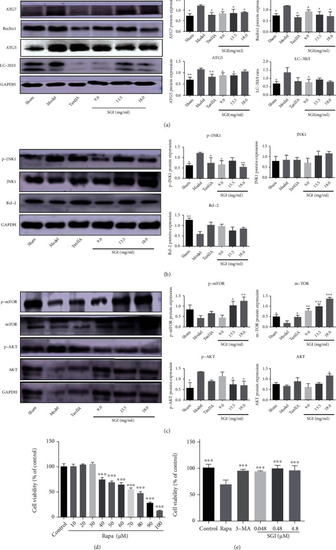
SGI regulates the expression of autophagy-related proteins. (a) ATG7, Beclin1, ATG5, and LC-3II/I; (b) Bcl-2, JNK1, and p-JNK1; (c) Akt, p-Akt, mTOR, and p-mTOR; compared with the model group, ∗ |
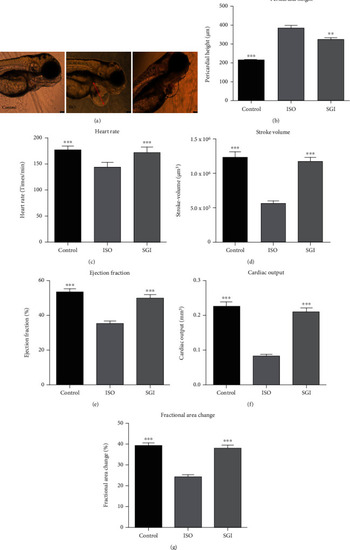
Improvement effect of SGI on heart function of ISO-induced zebrafish. Compared with the ISO group, ∗∗ PHENOTYPE:
|

SGI regulates the signal transduction of natriuretic peptide, autophagy, and ISO in zebrafish induced by ISO. Compared with the ISO group, ∗ |