
- Title
-
Computational refocusing of Jones matrix polarization-sensitive optical coherence tomography and investigation of defocus-induced polarization artifacts
- Authors
- Zhu, L., Makita, S., Oida, D., Miyazawa, A., Oikawa, K., Mukherjee, P., Lichtenegger, A., Distel, M., Yasuno, Y.
- Source
- Full text @ Biomed. Opt. Express
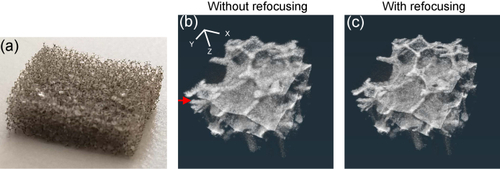
(a) The plastic foam used to fabricate the phantom. The plastic foam was embedded in silicone rubber. (b) and (c) are 3-D reconstructions of OCT intensity without (b) and with (c) computational refocusing. The red arrow indicates the depth location of |
Intensity |
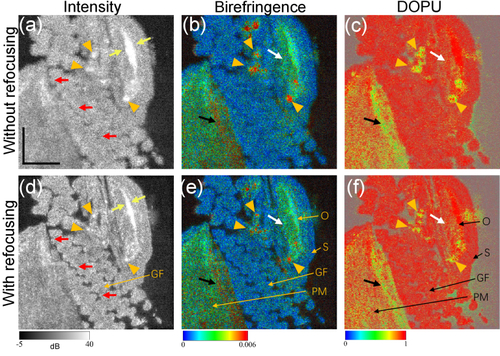
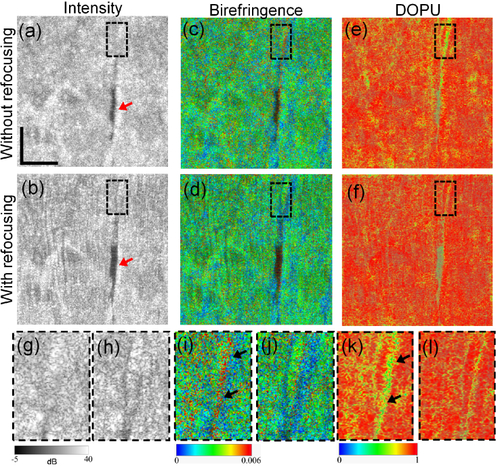
Zebrafish imaging results. (a)-(c) are the intensity, birefringence, and DOPU images without refocusing, respectively. (d)-(f) are the corresponding images with computational refocusing. Orange arrowheads indicate particles with strong reflection. Red arrows indicate the gill filament and yellow arrows the operculum. Black arrows indicate projection artifacts of birefringence and DOPU caused by structure superior to the imaged slice. White arrows indicate areas adjacent to the operculum, which might be operculum musculature or adductor mandibulae. Abbreviations: O, operculum; S, skin; GF, gill filament; PM, pectoral fin muscle. Scale bar denotes 500 |
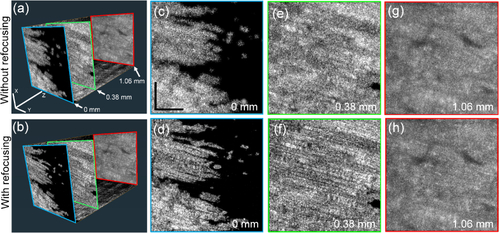
Original (first row) and computationally refocused (second row) OCT volumes of the porcine muscle sample. (a) and (b) 3-D reconstructed cut-away volumes. (c)-(h) are |
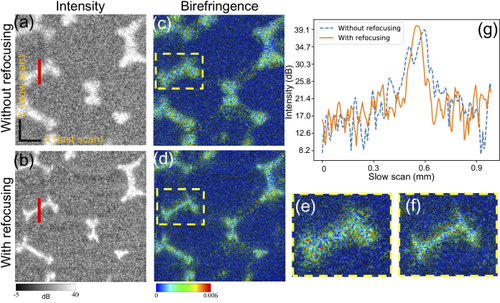
Original (first column) and computationally refocused (second column) |
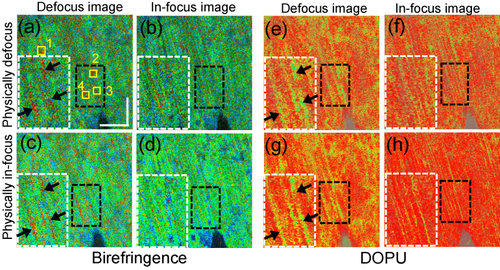
Comparisons of physically/computationally in-focus and physically/computationally defocused images. (a) and (e) are physically defocused images, and (b) and (f) are corresponding computationally refocused images. (d) and (h) are physically in-focus images, while (c) and (g) are computationally defocused versions of these images. The white-box insets are the magnified images of the black-box regions. The black arrows indicate the polarization artifacts. Yellow boxes denote four manually selected areas with a 15 |
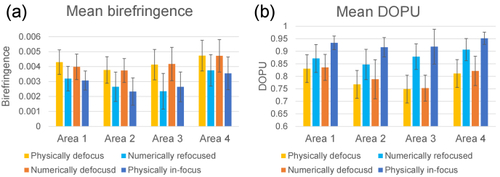
Mean birefringence (a) and DOPU (b) at four regions in |
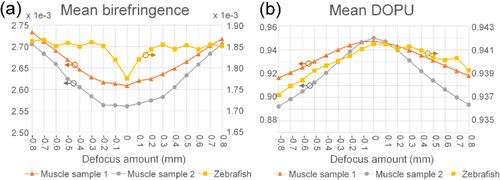
The dependency of the mean birefringence (a) and DOPU (b) on the amount of defocusing. Vertical axes indicate the mean birefringence (a) and DOPU (b) over the whole |
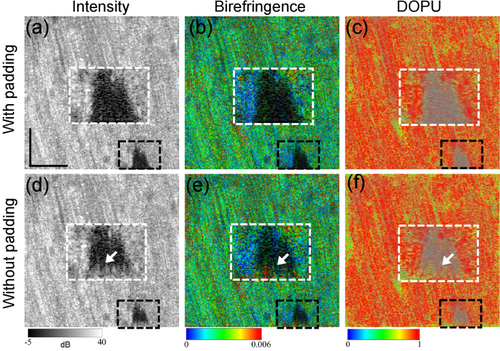
Artifacts that appear at the periphery of the |
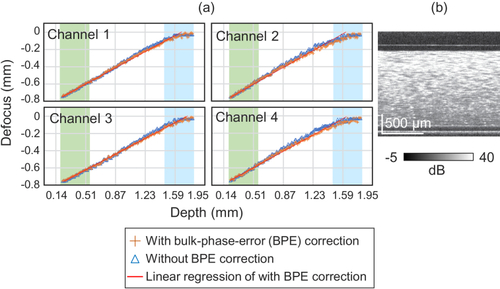
Defocus estimates are plotted against the sample depth. (a) Four plots represent four polarization channels, where each column and row correspond to each input and output polarizations, respectively. The defocus estimates were performed independently to each polarization channel. Orange crosses and blue triangles indicate the results with and without bulk-phase error correction, respectively. The red line is a linear regression line obtained from the data at the green region. The blue region indicates the region within the depth-of-focus (DOF). The data with bulk-phase error correction well agree with the regression line outside of DOF, while systemic departure can be found within the DOF as expected. (b) shows a representative cross-sectional OCT of the scattering phantom without refocusing. |