
FIGURE
Fig. 6.
- ID
- ZDB-FIG-220703-6
- Publication
- Zhu et al., 2022 - Computational refocusing of Jones matrix polarization-sensitive optical coherence tomography and investigation of defocus-induced polarization artifacts
- Other Figures
- All Figure Page
- Back to All Figure Page
Fig. 6.
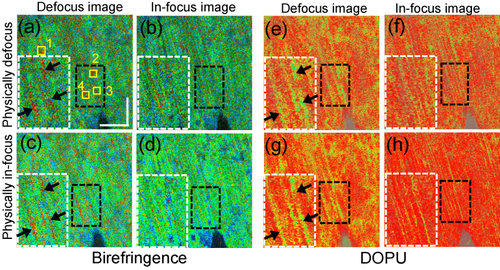
Comparisons of physically/computationally in-focus and physically/computationally defocused images. (a) and (e) are physically defocused images, and (b) and (f) are corresponding computationally refocused images. (d) and (h) are physically in-focus images, while (c) and (g) are computationally defocused versions of these images. The white-box insets are the magnified images of the black-box regions. The black arrows indicate the polarization artifacts. Yellow boxes denote four manually selected areas with a 15 |
Expression Data
Expression Detail
Antibody Labeling
Phenotype Data
Phenotype Detail
Acknowledgments
This image is the copyrighted work of the attributed author or publisher, and
ZFIN has permission only to display this image to its users.
Additional permissions should be obtained from the applicable author or publisher of the image.
Full text @ Biomed. Opt. Express