
|
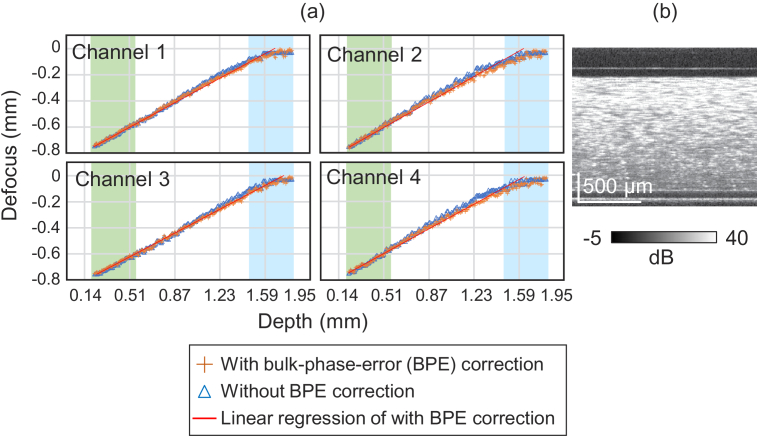
Fig. 10.
Defocus estimates are plotted against the sample depth. (a) Four plots represent four polarization channels, where each column and row correspond to each input and output polarizations, respectively. The defocus estimates were performed independently to each polarization channel. Orange crosses and blue triangles indicate the results with and without bulk-phase error correction, respectively. The red line is a linear regression line obtained from the data at the green region. The blue region indicates the region within the depth-of-focus (DOF). The data with bulk-phase error correction well agree with the regression line outside of DOF, while systemic departure can be found within the DOF as expected. (b) shows a representative cross-sectional OCT of the scattering phantom without refocusing.