FIGURE SUMMARY
Title

A Subset of Oligodendrocyte Lineage Cells Interact With the Developing Dorsal Root Entry Zone During Its Genesis

Authors
Green, L.A., Gallant, R.M., Brandt, J.P., Nichols, E.L., Smith, C.J.
Source
Full text @ Front. Cell. Neurosci.

A distinct population of OPCs associates with sensory nerves. (A) Plot of individual OPCs with less direct migration versus individual OPCs with a more direct migration. Green dots denote OPC that migrate less and directly. Blue dots denote OPC with longer distances of migration. (B) Confocal z-stack images from Tg(sox10:megfp);Tg(nbt:dsred) and Tg(ngn1:gfp);Tg(sox10:mrfp) animals at 72 hpf showing that dorsal migrating oligodendrocytes associate specifically with sensory neurons. White arrow represents oligodendrocyte associated with sensory neurons and white arrowheads represent sensory axons. (C) Quantification of the percentage of OLCs located across specific regions in the spinal cord. (D) Quantification of the number of sensory OLs located between specific DRGs. Each point represents one individual sensory OL. Zebrafish diagram in the upper right represents locations of OLC 1 and 2 along the spinal cord. (E) Images from a 24 h time-lapse starting at 72 hpf in Tg(sox10:mrfp) animals showing the ablation of sensory and non-sensory OLs and surrounding OPC response. Blue arrow represents a non-sensory OL. Green arrow represents a sensory OL. Orange arrowheads represent a responding OPC following non-sensory OL ablation. (F) Quantification of the distance surrounding OPCs traveled over time immediately following sensory OL ablation. (G) Quantification of the distance surrounding OPCs traveled over time immediately following non-sensory ablation. Scale bar equals 10 μm (B,E). All images are orientated anterior to left, posterior to right, dorsal up and ventral down.

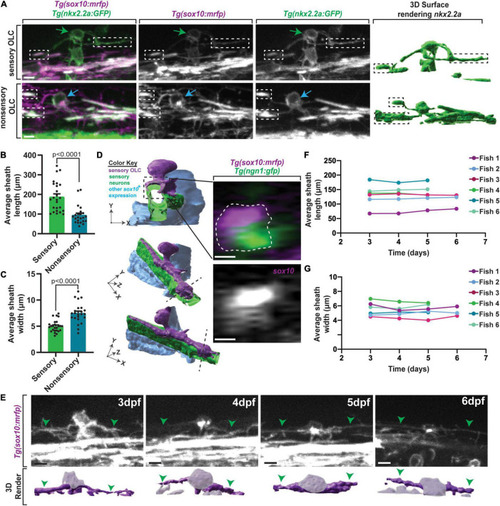
Sensory OLs maintain a distinct sheath profile. (A) Confocal z-stack still images of Tg(nkx2.2a:gfp);Tg(sox10:mrfp) animals at 72 hpf showing the distinct sheath profile of sensory OLs compared to non-sensory OLs. Green arrows represent a sensory OL. Blue arrows represent a non-sensory OL. White and black boxes represent examples of sheathes. (B) Quantification of the average sheath length of sensory OLs compared to non-sensory OLs (p < 0.0001). (C) Quantification of the average sheath width of sensory OLs compared to non-sensory OLs (p < 0.0001). (D) 3D IMARIS surface rendering (left) of a sensory-related OLC in Tg(sox10:mrfp);Tg(ngn1:gfp) animals from a confocal z-stack image (right) represented at three different angles to show ensheathment of sensory axons. White dashed line represents the cross section view. (E) Confocal z-stack images (top row) and IMARIS 3D surface rendering (bottom row) of an individual sensory OL in the same Tg(sox10:mrfp) animal at 3dpf, 4dpf, 5dpf, and 6dpf (top row). Green arrowheads represent the sensory axon. Grayed out regions on surface rendering represent sensory OL cell body. (F) Quantification of the average sheath length of the same OL in the same animal over time. (G) Quantification of the average sheath width of the same OL in the same animals over time. Scale bar equals 10 μm (A,D,E). All images are orientated anterior to left, posterior to right, dorsal up and ventral down.

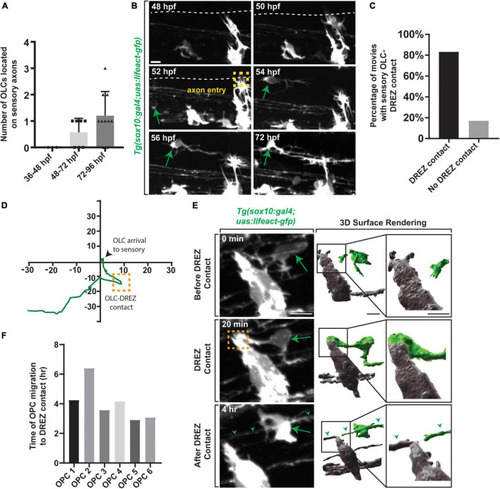
Oligodendrocyte progenitor cells contact the DREZ immediately following axon entry. (A) Quantification of the number of OPCs located with DRG sensory nerves from 36 to 96 hpf. (B) Images from a 24 h time-lapse movie starting at 48 hpf in Tg(sox10:gal4; uas:lifeact-gfp) zebrafish showing OPC migration initiation following axon entry. Green arrow represents migrating OPC. Yellow box represents axon entry. (C) Quantification of the percentage of movies where oligodendrocytes arrived to the sensory with or without DREZ contact. (D) Migration plot of the path an oligodendrocyte traveled from the ventral spinal cord region to sensory axons. Orange box represents DREZ contact. (E) Images from a 24 h time-lapse movie starting at 48 hpf in Tg(sox10:gal4; uas:lifeact-gfp) zebrafish showing an oligodendrocyte extending a cellular process that contacts the DREZ. Green arrow represents OPC projection that contacts the DREZ. Orange box indicates OPC-DREZ contact. Green arrowheads represent the sensory axon. IMARIS 3D surface rendering of the 20 min confocal image in showing an OLC cellular process contacting the DREZ. Gray cells are DRG and peripherally located. Green cell is the sensory OL. (F) Quantification of the time it takes for an individual OPC to initiate migration post-axon entry and contact the DREZ. Scale bar equals 10 μm (B,E). All images are orientated anterior to left, posterior to right, dorsal up and ventral down.

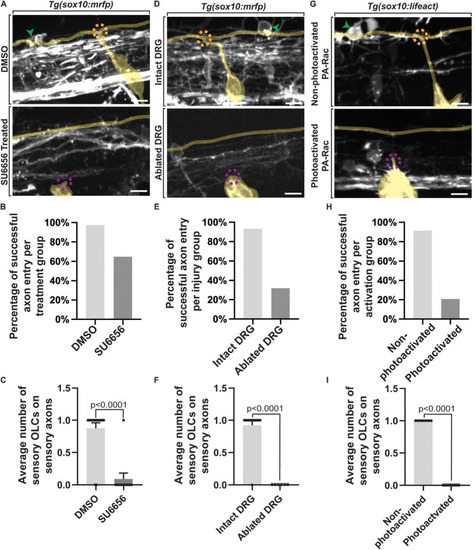
Failed axon entry does not result in sensory-related OLCs. (A) Confocal z-stack images of Tg(sox10:mrfp);Tg(ngn1:gfp) zebrafish at 3 dpf showing axon entry and the presence or absence of a sensory-related OLC in DMSO control animals compared to SU6656 treated animals. (B) Quantification representing the percentage of successful axon entry events per DMSO group versus SU6656 treatments. (C) Quantification of the average number of sensory-related OLCs on sensory axons in DMSO versus SU6656 treated animals (p < 0.0001). (D) Confocal z-stack images of Tg(sox10:mrfp); Tg(ngn1:gfp) zebrafish at 3 dpf showing axon entry and the presence or absence of a sensory OL in intact animals compared to animals with ablated DRGs. (E) Quantification representing the percentage of successful axon entry events per intact group versus ablated DRGs. (F) Quantification of the average number of sensory OCLs on sensory axons in intact DRGs versus ablated DRGs (p < 0.0001). (G) Confocal z-stack images of Tg(sox10:gal4; uas:lifeact-gfp) animals injected with PA-Rac1 at 3 dpf showing axon entry and the presence or absence of a sensory-related OLC in non-photoactivated animals compared to photoactivated animals. (H) Quantification representing the percentage of successful axon entry events per non-photoactivated group versus the photoactivated group. (I) Quantification of the average number of sensory-related OLCs on sensory axons in non-photoactivated versus photoactivated animals (p < 0.0001). All green arrowheads represent sensory-related OLCs. All dashed orange circles represent successful axon entry. All dashed magenta circles represent failed axon entry. Yellow tracing overlays highlight the DRG and sensory axons (A,D,G). Scale bar equals 10 μm (A,D,G). All images are orientated anterior to left, posterior to right, dorsal up and ventral down.

Early axon entry promotes early OPC migration to sensory nerves. (A) Images from a 24 h time-lapse movie starting at 48 hpf in Tg(sox10:gal4; uas:lifeact-gfp) zebrafish treated with Paclitaxel showing axon initiation and sensory-related OLC and DREZ contact earlier than typical axon entry. Green arrows represent migrating sensory-related OLC. (B) Still Images from a 24 h time-lapse movie starting at 48 hpf in intact and lesioned Tg(sox10:gal4;uas:lifeact-gfp);Tg(gfap:nsfb-mcherry) zebrafish also showing axon initiation and successful axon entry earlier than typical axon entry. White dashed line indicates lesion site. (C) Quantification of average time to axon entry in DMSO and Paclitaxel treated animals (p = 0.0081). (D) Quantification of the average time to sensory-related OLC migration post-axon entry in DMSO and Paclitaxel treated animals (p = 0.0338). (E,F) Paralleled quantifications of C-D in Lesioned and Non-lesioned animals (D = p < 0.0001, E = p = 0.0467). (G) Quantification of the average distance and time three OLCs migrated post-axon entry in DMSO and Paclitaxel treated animals and lesioned and non-lesioned animals. Orange arrowhead indicates start of timelapse at 48 hpf. Blue rectangles highlight the time of axon entry. Orange boxes indicate OLC-DREZ contact. Scale bar equals 10 μm (A,B). All images are orientated anterior to left, posterior to right, dorsal up and ventral down.

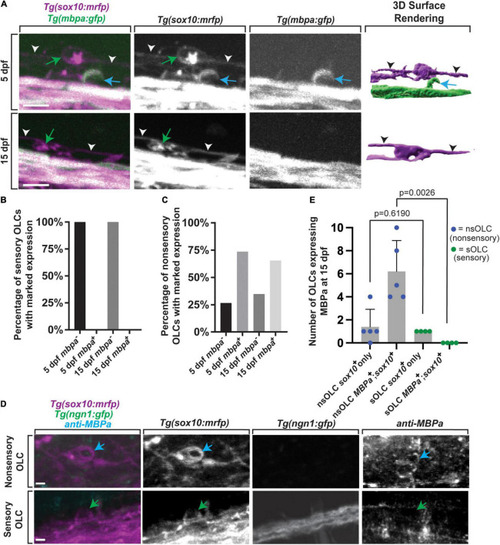
Sensory-related OLCs do not express typical OLC mbpa expression. (A) Confocal z-stack still images of Tg(mbpa:gfp);Tg(sox10:mrfp) animals at 5 and 15 dpf showing the lack of mbpa+ expression in sensory oligodendrocytes. Blue arrows represent non-sensory-related OLCs. Green arrows represent sensory-related OLCs. White and black arrowheads indicate sensory axons. (B) Quantification of the percentage of mbpa;sox10+ and mbpa+;sox10+ sensory OLs at 5 and 15 dpf. (C) Quantification of the percentage of mbpa;sox10+ and mbpa+;sox10+ non-sensory OLs at 5 and 15 dpf. (D) Confocal z-stack still images of Tg(sox10:mrfp);Tg(ngn1:gfp) animals at 15 dpf stained with an anti-MBPa antibody showing the lack of anti-MBPa in sensory-related OLCs. Blue arrows represent non-sensory-related OLCs and green arrows represent sensory-related OLCs. (E) Quantification of the number of non-sensory-related OLCs (nsOLCs) and sensory-related OLCs (sOLCs) expressing sox10+ only or at 15 dpf. Scale bar equals 10 μm (A,E). All images are orientated anterior to left, posterior to right, dorsal up and ventral down.

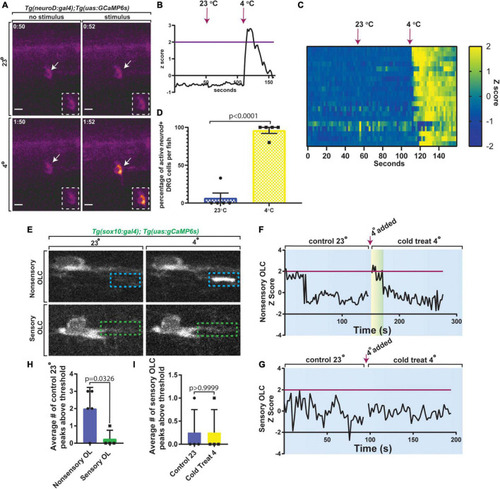
Sensory-related OLCs display distinct Ca2+ transients compared to non-sensory-related OLCs. (A) Images of Tg(neurod:gal4); Tg(uas:gCaMP6s) at 3 dpf showing calcium transients in DRG neurons after exposure to 23 or 4°C water. (B) Quantification of the Z Score of gCaMP6s intensity over time. Magenta line indicates Z score threshold above 2. Magenta arrow indicates the point at which 23 or 4°C water was added. (C) Heatmap representing each DRG neuron and the relative change in gCaMP6s intensity between exposure of 23 or 4°C water over time. (D) Quantification of the percentage of active DRG neuroD+ cells per animal in 23°C control temperature compared to 4°C water (p < 0.0001). (E) Images from a 3 min time-lapse in Tg(sox10:gal4); Tg(uas:gCaMP6s) zebrafish showing calcium transients in non-sensory-related OLCs compared to sensory-related OLCs upon exposure to 4°C water. Blue dashed boxes indicate the region of Ca2+ transient activity in non-sensory-related OLCs. Green dashed boxes indicate lack of Ca2+ transient activity in sensory-related OLCs. (F) Quantification of Z Score representing Ca2+ transient activity in non-sensory-related OLCs upon exposure to 4°C water. (G) Quantification of Z Score representing the lack of Ca2++ transient activity in sensory-related OLCs upon exposure to 4°C water. Magenta line indicates standard deviation threshold above 2 and magenta arrow indicates the point at which 4°C water was added in both F and G. Any peak above this magenta line indicates a positive peak value for calcium expression. (H) Quantification of the average number of control 23°C peaks above threshold in sensory-related OLCs versus non-sensory-related OLCs (p = 0.0326). (I) Quantification of the average number of sensory-related OLCs peaks above the threshold in control 23°C versus 4°C water animals (p > 0.9999). Scale bar equals 10 μm (A,E). All images are orientated anterior to left, posterior to right, dorsal up and ventral down.

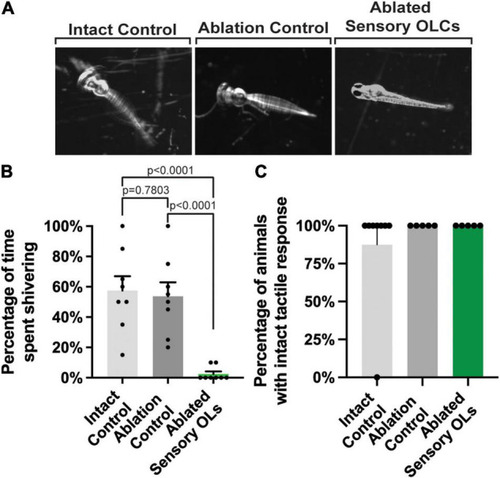
Sensory-related OLC ablation disrupts sensory behavior. (A) Images of three timepoints from a 20 s movies overlayed as a maximum projection in intact, ablation control, and ablated sensory OL animals showing the change in twitching behavior in sensory OL ablated animals upon exposure to cold water treatment. (B) Quantification of the percentage of time intact, ablated control, and sensory OL ablated animals spent shivering upon exposure to cold water treatment (p < 0.0001, p = 0.7803, p < 0.0001). (C) Quantification of the percentage of intact, ablated, or sensory-related OLC ablated animals the exhibited a tactile response. All images are orientated anterior to left, posterior to right, dorsal up and ventral down.

Acknowledgments
This image is the copyrighted work of the attributed author or publisher, and ZFIN has permission only to display this image to its users. Additional permissions should be obtained from the applicable author or publisher of the image. Full text @ Front. Cell. Neurosci.