IMAGE

FIGURE 3

ID
ZDB-IMAGE-220625-15
Source
Figures for Green et al., 2022
Image
Figure Caption

FIGURE 3

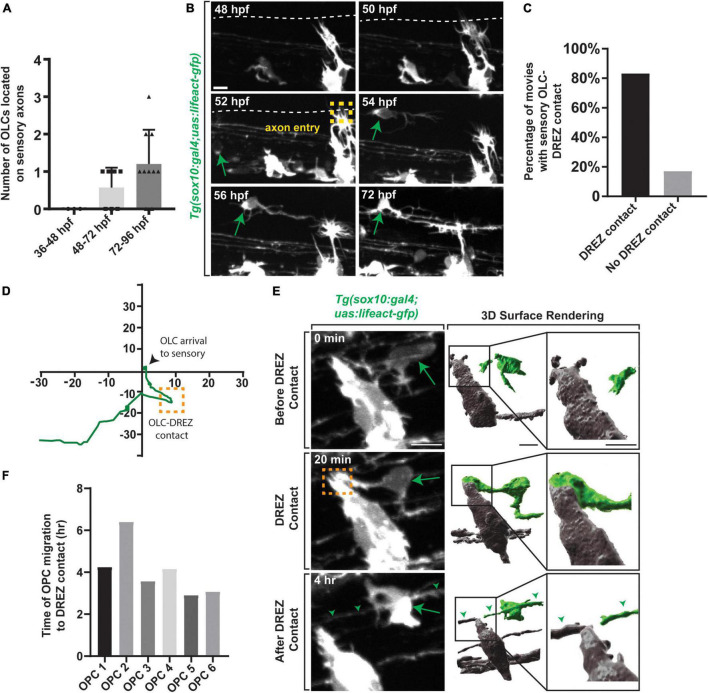
Oligodendrocyte progenitor cells contact the DREZ immediately following axon entry. (A) Quantification of the number of OPCs located with DRG sensory nerves from 36 to 96 hpf. (B) Images from a 24 h time-lapse movie starting at 48 hpf in Tg(sox10:gal4; uas:lifeact-gfp) zebrafish showing OPC migration initiation following axon entry. Green arrow represents migrating OPC. Yellow box represents axon entry. (C) Quantification of the percentage of movies where oligodendrocytes arrived to the sensory with or without DREZ contact. (D) Migration plot of the path an oligodendrocyte traveled from the ventral spinal cord region to sensory axons. Orange box represents DREZ contact. (E) Images from a 24 h time-lapse movie starting at 48 hpf in Tg(sox10:gal4; uas:lifeact-gfp) zebrafish showing an oligodendrocyte extending a cellular process that contacts the DREZ. Green arrow represents OPC projection that contacts the DREZ. Orange box indicates OPC-DREZ contact. Green arrowheads represent the sensory axon. IMARIS 3D surface rendering of the 20 min confocal image in showing an OLC cellular process contacting the DREZ. Gray cells are DRG and peripherally located. Green cell is the sensory OL. (F) Quantification of the time it takes for an individual OPC to initiate migration post-axon entry and contact the DREZ. Scale bar equals 10 μm (B,E). All images are orientated anterior to left, posterior to right, dorsal up and ventral down.

Acknowledgments
This image is the copyrighted work of the attributed author or publisher, and ZFIN has permission only to display this image to its users. Additional permissions should be obtained from the applicable author or publisher of the image. Full text @ Front. Cell. Neurosci.