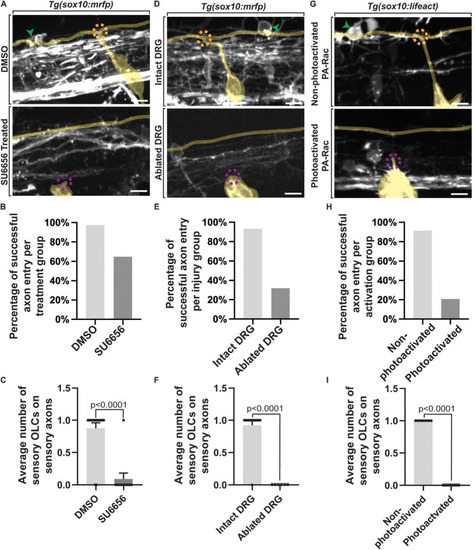
Failed axon entry does not result in sensory-related OLCs. (A) Confocal z-stack images of Tg(sox10:mrfp);Tg(ngn1:gfp) zebrafish at 3 dpf showing axon entry and the presence or absence of a sensory-related OLC in DMSO control animals compared to SU6656 treated animals. (B) Quantification representing the percentage of successful axon entry events per DMSO group versus SU6656 treatments. (C) Quantification of the average number of sensory-related OLCs on sensory axons in DMSO versus SU6656 treated animals (p < 0.0001). (D) Confocal z-stack images of Tg(sox10:mrfp); Tg(ngn1:gfp) zebrafish at 3 dpf showing axon entry and the presence or absence of a sensory OL in intact animals compared to animals with ablated DRGs. (E) Quantification representing the percentage of successful axon entry events per intact group versus ablated DRGs. (F) Quantification of the average number of sensory OCLs on sensory axons in intact DRGs versus ablated DRGs (p < 0.0001). (G) Confocal z-stack images of Tg(sox10:gal4; uas:lifeact-gfp) animals injected with PA-Rac1 at 3 dpf showing axon entry and the presence or absence of a sensory-related OLC in non-photoactivated animals compared to photoactivated animals. (H) Quantification representing the percentage of successful axon entry events per non-photoactivated group versus the photoactivated group. (I) Quantification of the average number of sensory-related OLCs on sensory axons in non-photoactivated versus photoactivated animals (p < 0.0001). All green arrowheads represent sensory-related OLCs. All dashed orange circles represent successful axon entry. All dashed magenta circles represent failed axon entry. Yellow tracing overlays highlight the DRG and sensory axons (A,D,G). Scale bar equals 10 μm (A,D,G). All images are orientated anterior to left, posterior to right, dorsal up and ventral down.
|
