FIGURE SUMMARY
Title

Stage Specific Transcriptomic Analysis and Database for Zebrafish Oogenesis

Authors
Bogoch, Y., Jamieson-Lucy, A., Vejnar, C.E., Levy, K., Giraldez, A.J., Mullins, M.C., Elkouby, Y.M.
Source
Full text @ Front Cell Dev Biol

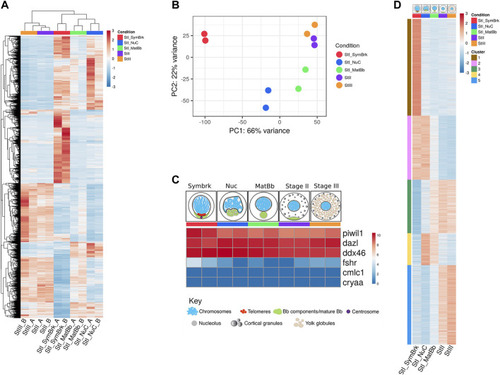
A high throughput analysis of 5 stages of oocyte development. (A) Unsupervised hierarchical clustering of all genes that were changed between any of the stages. Samples are ordered according to clustering. (B) PCA of the duplicates of the different stages. (C) Control gene expression confirms the accuracy of our data. Germ cell specific genes are expressed, but somatic markers show background expression comparable with expression of non-ovarian genes images of oocyte stages groups were modified from Elkouby and Mullins (Elkouby and Mullins 2017a). (D) Heat map of k-means clustering of genes that were differentially expressed as determined by a likelihood ratio test. Five clusters were determined to allow visualization of the expression trends. Each stage is represented by a color throughout the figures: red for Symbrk, blue for Nuc, green for MatBb, purple for Stage II, and orange for Stage III. Red denotes higher expressed genes and blue denotes lower expressed genes. The numbers are normalized relative expression. Each column is the average of the duplicates.

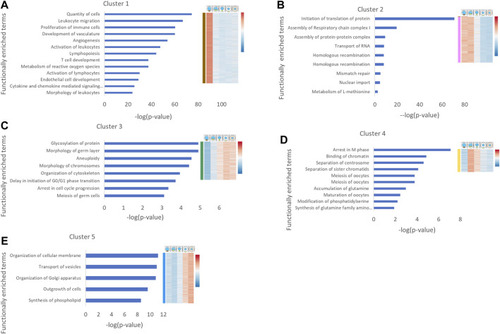
Functional enrichment analysis of gene expression clusters in oogenesis. Human homologues of genes from each cluster were analyzed by IPA. Cancer related functions were removed. The main functionally enriched terms for each cluster are shown. The X axis is the [–log (p-value)] corrected for FDR. Heat map on the right shows the corresponding cluster expression pattern derived from Figure 1C. Cartoons above the heatmap depict the different stages. The heat map shows relative expression of genes, where red denotes higher expressed genes and blue denotes lower expressed genes.

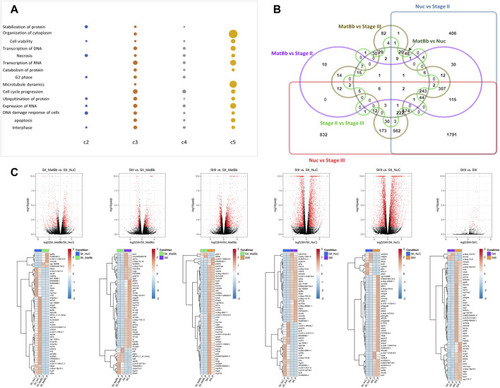
Analysis of differentially expressed genes of different stages. (A) A dot plot of functionally enriched terms that were associated with at least 3 different clusters. The size of the dot is representative of the [– log(p-value)] corrected for FDR. The larger the dot the smaller the p value. A missing dot means that the specific function was not found in the cluster. (B) Edwards venn diagram of differential expression of genes between all pairs. The Symbreak stage was omitted from the analysis. Each pairwise analysis is denoted by name, color, and shape. Genes were determined as differentially expressed if they had a fold change of at least 2 and FDR<0.05. (C) Top: Volcano plots of pairwise analysis of DEGs. Red dots are for significant genes, black dots are for all other genes (not significant). Bottom: Heat maps for the top 50 significantly expressed genes according to absolute fold change.

Functional analysis of pairwise comparisons. (A) Genes that were upregulated in Nuc over Stage II show many RNA functions, and genes that were up regulated in Stage II over Nuc show many biosynthesis, metabolic and membrane processes. (B) A scheme showing two phases of prominent differentiation activities in oogenesis determined by functional analysis of clusters and pairwise DEGs. The early phase includes mostly meiotic functions and RNA processing and regulation. The late phase includes mostly metabolic and cellular growth functions. Maternal embryonic regulators gradually increase their expression in parallel to these two phases.

Acknowledgments
This image is the copyrighted work of the attributed author or publisher, and ZFIN has permission only to display this image to its users. Additional permissions should be obtained from the applicable author or publisher of the image. Full text @ Front Cell Dev Biol