FIGURE

FIGURE 1

ID
ZDB-FIG-220625-8
Publication
Bogoch et al., 2022 - Stage Specific Transcriptomic Analysis and Database for Zebrafish Oogenesis
Other Figures
All Figure Page
Back to All Figure Page
FIGURE 1

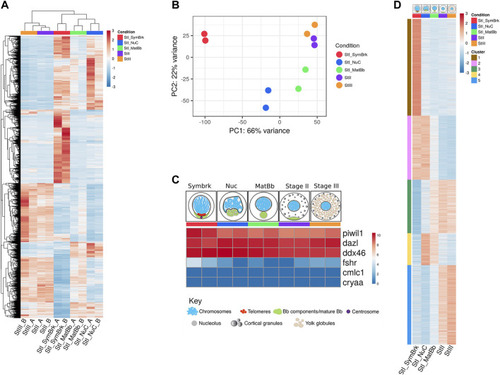
A high throughput analysis of 5 stages of oocyte development. (A) Unsupervised hierarchical clustering of all genes that were changed between any of the stages. Samples are ordered according to clustering. (B) PCA of the duplicates of the different stages. (C) Control gene expression confirms the accuracy of our data. Germ cell specific genes are expressed, but somatic markers show background expression comparable with expression of non-ovarian genes images of oocyte stages groups were modified from Elkouby and Mullins (Elkouby and Mullins 2017a). (D) Heat map of k-means clustering of genes that were differentially expressed as determined by a likelihood ratio test. Five clusters were determined to allow visualization of the expression trends. Each stage is represented by a color throughout the figures: red for Symbrk, blue for Nuc, green for MatBb, purple for Stage II, and orange for Stage III. Red denotes higher expressed genes and blue denotes lower expressed genes. The numbers are normalized relative expression. Each column is the average of the duplicates.

Expression Data

Expression Detail
Antibody Labeling
Phenotype Data

Phenotype Detail
Acknowledgments
This image is the copyrighted work of the attributed author or publisher, and ZFIN has permission only to display this image to its users. Additional permissions should be obtained from the applicable author or publisher of the image. Full text @ Front Cell Dev Biol