
FIGURE
FIGURE 2
- ID
- ZDB-FIG-220625-9
- Publication
- Bogoch et al., 2022 - Stage Specific Transcriptomic Analysis and Database for Zebrafish Oogenesis
- Other Figures
- All Figure Page
- Back to All Figure Page
FIGURE 2
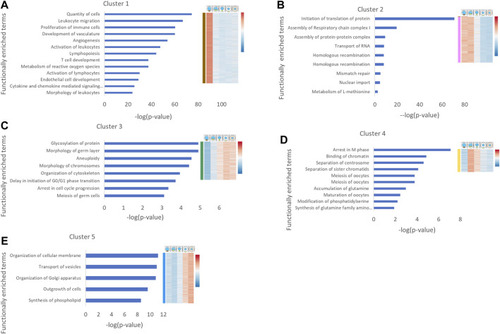
Functional enrichment analysis of gene expression clusters in oogenesis. Human homologues of genes from each cluster were analyzed by IPA. Cancer related functions were removed. The main functionally enriched terms for each cluster are shown. The |
Expression Data
Expression Detail
Antibody Labeling
Phenotype Data
Phenotype Detail
Acknowledgments
This image is the copyrighted work of the attributed author or publisher, and
ZFIN has permission only to display this image to its users.
Additional permissions should be obtained from the applicable author or publisher of the image.
Full text @ Front Cell Dev Biol