IMAGE

FIGURE 3

ID
ZDB-IMAGE-220625-11
Source
Figures for Bogoch et al., 2022
Image
Figure Caption

FIGURE 3

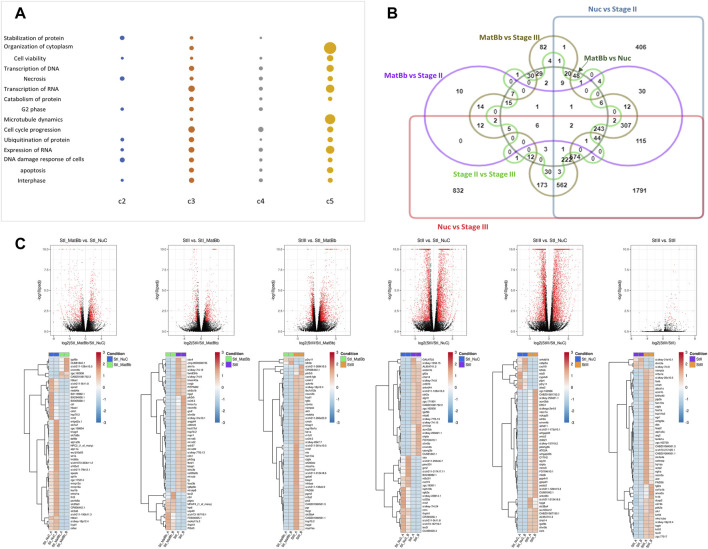
Analysis of differentially expressed genes of different stages. (A) A dot plot of functionally enriched terms that were associated with at least 3 different clusters. The size of the dot is representative of the [– log(p-value)] corrected for FDR. The larger the dot the smaller the p value. A missing dot means that the specific function was not found in the cluster. (B) Edwards venn diagram of differential expression of genes between all pairs. The Symbreak stage was omitted from the analysis. Each pairwise analysis is denoted by name, color, and shape. Genes were determined as differentially expressed if they had a fold change of at least 2 and FDR<0.05. (C) Top: Volcano plots of pairwise analysis of DEGs. Red dots are for significant genes, black dots are for all other genes (not significant). Bottom: Heat maps for the top 50 significantly expressed genes according to absolute fold change.

Acknowledgments
This image is the copyrighted work of the attributed author or publisher, and ZFIN has permission only to display this image to its users. Additional permissions should be obtained from the applicable author or publisher of the image. Full text @ Front Cell Dev Biol