
- Title
-
Maternal Factors and Nodal Autoregulation Orchestrate Nodal Gene Expression for Embryonic Mesendoderm Induction in the Zebrafish
- Authors
- Xing, C., Shen, W., Gong, B., Li, Y., Yan, L., Meng, A.
- Source
- Full text @ Front Cell Dev Biol
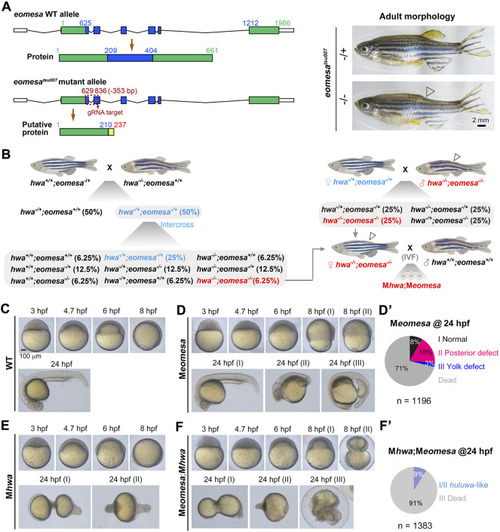
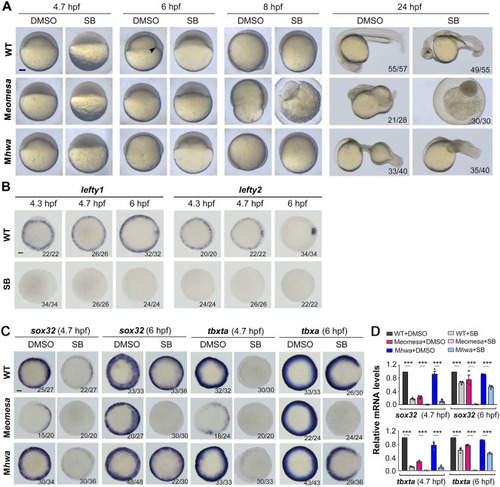
Phenotypes of different mutants at various stages. |
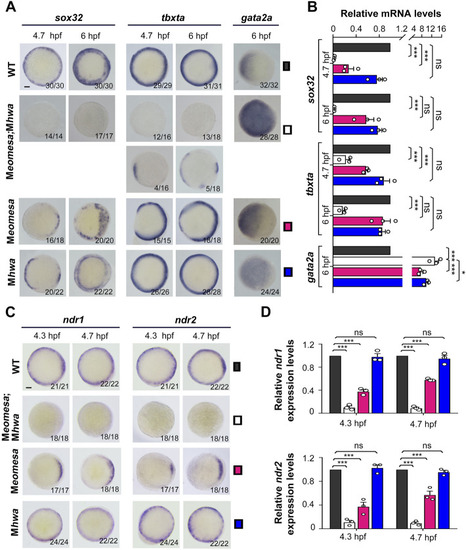
Expression patterns of mesendodermal markers and |
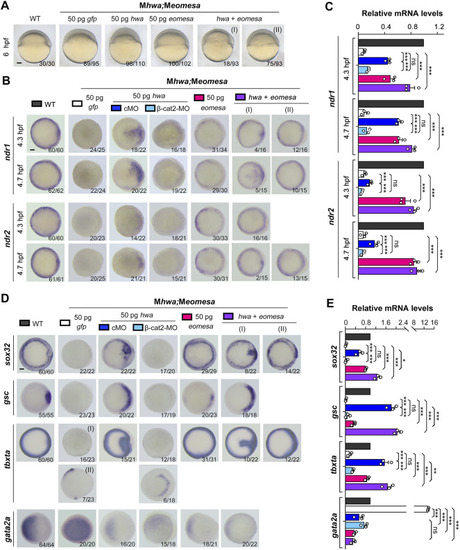
Induction of |
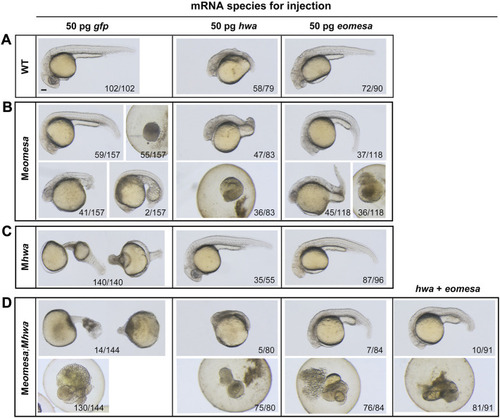
Overexpression effect of |
Responses of M |
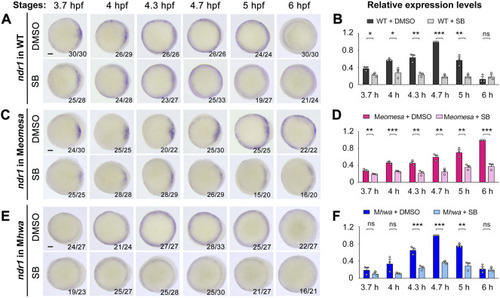
Effect of Nodal signaling inhibition on |
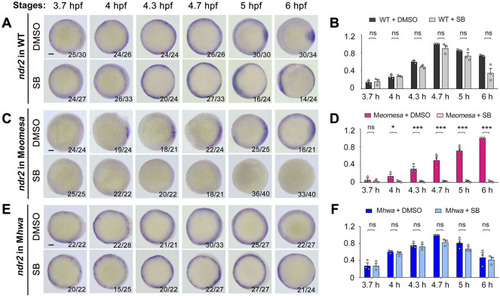
Effect of Nodal signaling inhibition on |

Illustration of contributions of maternal |