FIGURE

FIGURE 3

ID
ZDB-FIG-220616-13
Publication
Xing et al., 2022 - Maternal Factors and Nodal Autoregulation Orchestrate Nodal Gene Expression for Embryonic Mesendoderm Induction in the Zebrafish
Other Figures
All Figure Page
Back to All Figure Page
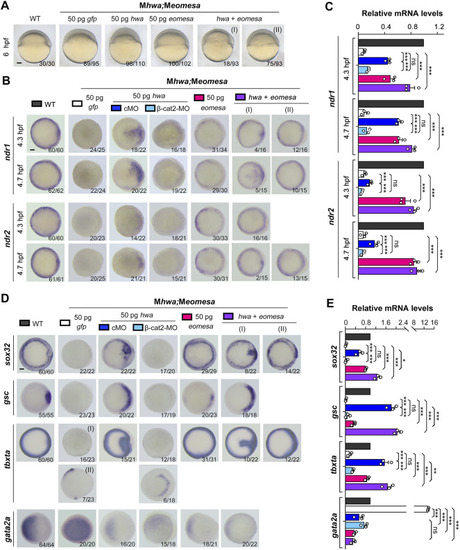
FIGURE 3

Induction of nodal genes and mesendodermal markers in Meomesa;Mhwa mutants by ectopic hwa or/and eomesa. One-cell stage mutant embryos were injected with corresponding mRNA or/and MO and observed for morphology at 6 hpf (A) or harvested at indicated stages for detection of selected genes by WISH (B,D) or by RT-PCR analysis (C,E). Embryos were positioned laterally (A) or in animal-pole view (B,D) with dorsal to the right if the dorsal side was perceptible. The ratio of embryos with the representative pattern was indicated in the right bottom. Scale bars: 100 μm. Injection doses of mRNA or MO: hwa and myc-eomesa, 50 pg/embryo; cMO (as control MO) and β-cat2-MO, 20 ng/embryo. qRT-PCR analysis was performed using 15 embryos per sample, and the expression level was normalized to that of eif4g2a in WT embryos at the same stage. Error bars indicated S.D. based on three biological replicates (indicated by small circles). Color keys for embryo types and treatments were shown in (A,B,D). Statistically significant level: ns, nonsignificant; *, p < 0.05; **, p < 0.01; ***, p < 0.001.

Expression Data

Expression Detail
Antibody Labeling
Phenotype Data

Phenotype Detail
Acknowledgments
This image is the copyrighted work of the attributed author or publisher, and ZFIN has permission only to display this image to its users. Additional permissions should be obtained from the applicable author or publisher of the image. Full text @ Front Cell Dev Biol