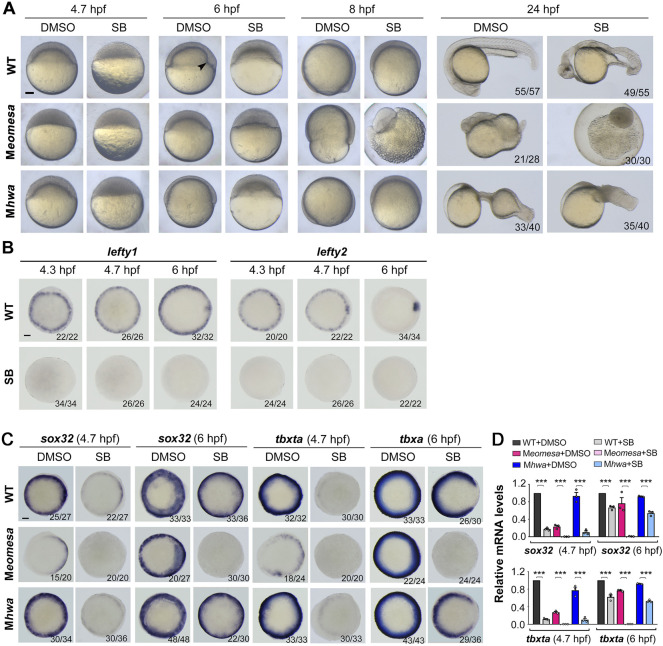
IMAGE

FIGURE 5

ID
ZDB-IMAGE-220616-15
Source
Figures for Xing et al., 2022
Image
Figure Caption

FIGURE 5

Responses of Meomesa and Mhwa mutants to Nodal signaling inhibition. One-cell stage embryos (10 min postfertilization) were incubated in Holfreter’s water with 1% DMSO (control) or 50 μM SB431542 (SB, the Nodal signaling inhibitor), and harvested at 24 hpf for morphological observation (A) or for detection of marker gene expression by WISH (B,C) or qRT-PCR analysis (D) at indicated stages. Note that inhibition of Nodal signaling aggravated mesendodermal defects in both Meomesa and Mhwa mutants (A). Embryos were positioned laterally (A) or in animal-pole view with dorsal to the right (B,C) if the dorsal or tail was perceptible. The embryonic shield in WT embryo at the shield stage was indicated by an arrowhead. Scale bars, 100 μm. The ratio of embryos with the representative pattern was indicated in the right bottom (B,C). qRT-PCR analysis was performed using 15 embryos per sample, and the expression level was normalized to that of eif4g2a in WT embryos at the same stage. Error bars indicated S.D. based on three biological replicates (indicated by small circles). Statistically significant level: ***, p < 0.001.

Acknowledgments
This image is the copyrighted work of the attributed author or publisher, and ZFIN has permission only to display this image to its users. Additional permissions should be obtained from the applicable author or publisher of the image. Full text @ Front Cell Dev Biol