
- Title
-
Opposing effects of deubiquitinase OTUD3 in innate immunity against RNA and DNA viruses
- Authors
- Cai, X., Zhou, Z., Zhu, J., Liu, X., Ouyang, G., Wang, J., Li, Z., Li, X., Zha, H., Zhu, C., Rong, F., Tang, J., Liao, Q., Chen, X., Xiao, W.
- Source
- Full text @ Cell Rep.
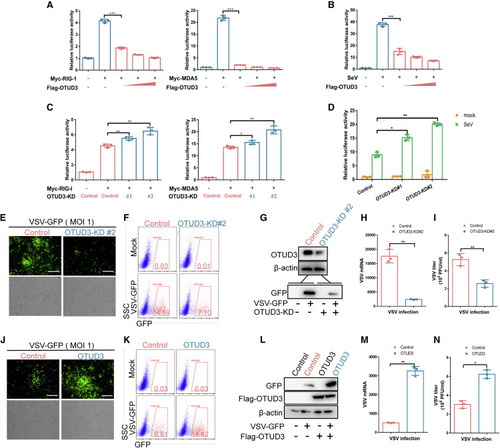
Figure 1. OTUD3 inhibits viral RNA-triggered signaling (A) Luciferase activity of IFN-β promoter reporter (300 ng) in HEK293T cells transfected with increased amounts of FLAG-OTUD3 plasmid (0, 200, 400, and 600 ng; wedge) together with either RIG-I (left) or MDA5 (right), respectively. (B) Luciferase activity of IFN-β promoter reporter (300 ng) in HEK293T cells transfected with increased amounts of FLAG-OTUD3 plasmid (0, 200, 400, and 600ng; wedge) followed by without/with SeV infection (MOI = 0.1). (C) Luciferase activity of IFN-β promoter reporter in OTUD3 knockdown HEK293T cells (OTUD3-KD #1 and OTUD3-KD #2) transfected with either RIG-I (left) or MDA5 (right) respectively. (D) Luciferase activity of IFN-β promoter reporter in OTUD3 knockdown HEK293T cells (OTUD3-KD #1 and OTUD3-KD #2) without (mock) or with SeV infection (MOI = 0.1). (E) Microscopy imaging of the replication of VSV-GFP in the control and OTUD3 knockdown (OTUD3-KD #2) HEK293T cells followed by VSV-GFP (1 MOI) challenge for 24 h. Scale bar, 200 μm. (F) Flow cytometry analysis of the replication of VSV-GFP in the control and OTUD3 knockdown (OTUD3-KD #2) HEK293T cells followed by VSV-GFP (MOI = 1) challenge for 24 h. Scale bar, 200 μm. (G) Immunoblotting for OTUD3 expression in the control and OTUD3 knockdown (OTUD3-KD #2) HEK293T cells, and the efficiency of VSV-GFP virus infection. (H and I) Quantitative real-time PCR (qRT-PCR) analysis of VSV mRNA and the measurement of virus titer in the control and OTUD3 knockdown (OTUD3-KD #2) HEK293T cells followed by VSV-GFP challenge for 24 h. (J) Microscopy imaging of the replication of VSV-GFP in the control and OTUD3-overexpressed HEK293T cells followed by VSV-GFP (MOI = 1) challenge for 24 h. (K) Flow cytometry analysis of the replication of VSV-GFP in the control and OTUD3-overexpressed HEK293T cells followed by VSV-GFP (MOI = 1) challenge for 24 h. (L) Immunoblotting for OTUD3 expression in the control and OTUD3-overexpressed HEK293T cells, and the efficiency of VSV-GFP virus infection. (M and N) qRT-PCR analysis of VSV mRNA and the measurement of virus titer in the control and OTUD3 overexpressed HEK293T cells followed by VSV-GFP challenge for 24 h. ∗p < 0.05, ∗∗p < 0.01, and ∗∗∗p < 0.001, using unpaired Student’s t test (A–D; H, I, M, and N). Data based on one representative experiment performed in three biological replicates from at least three independent experiments (mean ± SD) or representative data (E–G and J–L). |

Figure 2. OTUD3 inhibits RLR signaling by removing K63-linked ubiquitin chain on RIG-I and MDA5 (A and B) Immunoblotting (IB) for polyubiquitination of whole-cell lysates (bottom) and affinity purification with Ni2+-NTA resin (top) from HEK293T cells transfected with Myc-RIG-I (A) or HA-MDA5 (B) and His-tagged wild-type(WT) ubiquitin, His-tagged K48-only ubiquitin (K48O) (in which all lysine residues are mutated to arginine residues except lysine 48), His-tagged K63-only ubiquitin (K63O) (in which all lysine residues are mutated to arginine residues except lysine 63), His-tagged K48R ubiquitin (K48R) (in which only lysine 48 is mutated to arginine), or His-tagged K63R ubiquitin (K63R) (in which only lysine 48 is mutated to arginine), together with the empty vector or FLAG-OTUD3. (C and D) IB for polyubiquitination of whole-cell lysates and affinity purification with Ni2+-NTA resin from the control and OTUD3 knockdown (OTUD3-KD#2) HEK293T cells transfected with Myc-RIG-I (C) or HA-MDA5 (D) (3 μg/each), together with His-WT ubiquitin, His-K63O ubiquitin, or His-K63R ubiquitin (4 μg) for 24 h. (E and F) IB for polyubiquitination of whole-cell lysates and affinity purification with Ni2+-NTA resin from the control and OTUD3 knockdown (OTUD3-KD#2) HEK293T cells transfected with Myc-RIG-I-CARD (E) or Myc-MDA5-CARD (F) (3 μg/each) and His-K63O ubiquitin (4 μg) for 24 h, then infected with SeV or EMCV for the indicated times. (G and H) In vitro deubiquitination analysis of RIG-I (G) or MDA5 (H) by OTUD3. The lysates of HEK293T cells transfected with FLAG-RIG-I or FLAG-MDA5 (5 μg) together HA-ubiquitin (5 μg) were eluted with FLAG peptides and then incubated with the synthesized OTUD3 by an in vitro transcription and translation kit. The ubiquitination was detected by IB with anti-HA antibody. (I and J) IB for K63-linked polyubiquitination of endogenous RIG-I (I) or MDA5 (J) in WT and Otud3−/− BMDCs (1× 10⁸) stimulated with VSV or EMCV for 6 h. IP, immunoprecipitation; IB, immunoblotting; WCL, whole-cell lysate. Data are representative of three independent experiments (A–J). |

Figure 3. OTUD3-deficient mice are more resistant to EMCV infection (A) Survival (Kaplan-Meier curve) of Otud3+/+ and Otud−/− mice (n = 6 per group) at various times after intraperitoneal (i.p.) injection with EMCV (1 × 10⁶ plaque-forming units [PFU] per mouse). (B) ELISA of IFN-β in serum from Otud3+/+ and Otud3−/− mice (n = 5 per group) given i.p. injection of EMCV (1 × 10⁶ PFU per mouse) for 12 h. (C and D) qRT-PCR analysis of Ifnb, IL6, EMCV mRNA, and plaque assays for EMCV titers in the lungs (C) and spleens (D) from Otud3+/+ and Otud3−/− mice given i.p. injection of EMCV (1 × 10⁶ PFU per mouse) for 24 h. (E–G) Microscopy of H&E-stained (E), Ly6G-stained (F), or F480-stained lung sections from Otud3+/+ and Otud3−/− mice treated with PBS (mock) or EMCV (1 × 10⁶) for 48 h. Red arrows indicate positive cells. E Scale bar, 500 μm; (F and G) scale bar, 100 μm. ∗p < 0.05, ∗∗p < 0.01, and ∗∗∗p < 0.001, using unpaired Student’s t test (B–D) or log rank (Mantel-Cox) test (A). Data based on one representative experiment performed in three biological replicates from at least three independent experiments (mean ± SD) or representative data (A, E, F, and G). |
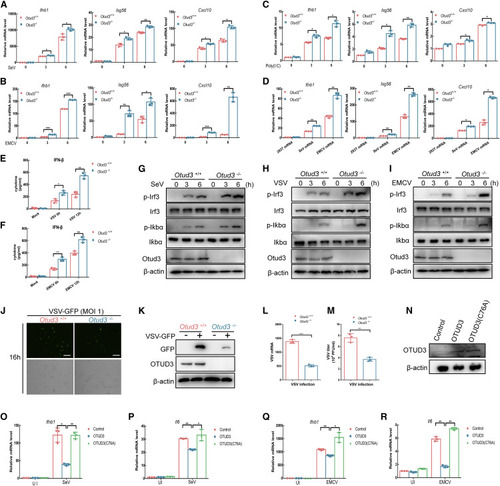
Figure 4. OTUD3-deficiency enhances RLR signaling in MLFs (A and B) qRT-PCR analysis of Ifnb1, Isg56, and Cxcl10 in Otud3+/+ and Otud3−/− MLFs un-infected or infected with SeV or EMCV for the indicated times. (C) qRT-PCR analysis of Ifnb1, Isg56, and Cxcl10 in Otud3+/+ and Otud3−/− MLFs transfected with poly(I:C) for the indicated times. (D) qRT-PCR analysis of Ifnb1, Isg56, and Cxcl10 in Otud3+/+ and Otud3−/− MLFs transfected with viral or synthetic RNAs for the indicated times. (E and F) ELISA of IFN-β in supernatant of Otud3+/+ and Otud3−/− MLFs infected with VSV or EMCV for 6–12 h. (G–I) IB of proteins in Otud3+/+ and Otud3−/− MLFs un-infected or infected with SeV, VSV, or EMCV for the indicated times by the indicated antibodies. (J) Fluorescence microscopy imaging of the replication of VSV-GFP in Otud3+/+ and Otud3−/− MLFs followed by the infection of VSV-GFP for 16 h. Scale bar, 200 μm. (K) IB of viruses-infection efficiency in Otud3+/+ and Otud3−/− MLFs followed by the infection of VSV-GFP for 16 h. (L) qRT-PCR analysis of VSV mRNA in Otud3+/+ and Otud3−/− MLFs followed by the infection of VSV-GFP for 16 h. (M) Plaque assay for VSV-GFP titers in Otud3+/+ and Otud3−/− MLFs followed by the infection of VSV-GFP for 16 h. (N) IB of reconstituted gene expression. (O–R) qRT-PCR analysis of Ifnb1 and Il6 in Otud3−/− BMDCs reconstituted with the empty phage (control), OTUD3, or OTUD3-C76A followed by infected with SeV or EMCV for 0–6 h. ∗p < 0.05, ∗∗p < 0.01, and ∗∗∗p < 0.001, using unpaired Student’s t test (L and M) or two-way ANOVA with Holm-Sidak’s multiple comparisons test (A–F and O–R). Data based on one representative experiment performed in three biological replicates from at least three independent experiments (mean ± SD) or representative data (G–I, J, K, and N). |
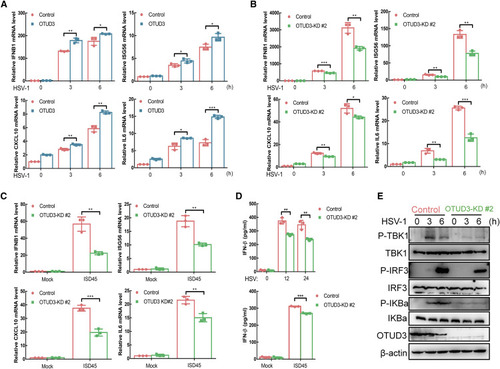
Figure 5. OTUD3 promotes viral DNA-triggered signaling (A) qRT-PCR analysis of IFNB1, ISG56, CXCL10, and IL6 in the control or OTUD3-overexpressed THP-1 cells un-infected or infected with HSV for the indicated times. (B) qRT-PCR analysis of IFNB1, ISG56, CXCL10, and IL6 in the control and OTUD3 knockdown THP-1 cells un-infected or infected with HSV-1 for the indicated times. (C) qRT-PCR analysis of IFNB1, ISG56, CXCL10, and IL6 in the control and OTUD3 knockdown THP-1 cells un-transfected or transfected with ISD45 for 6 h. (D) ELISA of IFN-β in supernatant of the control or OTUD3 knockdown THP-1 cells infected with HSV for 0–24 h (top), mock transfected or transfected with ISD45 for 12 h (bottom). (E) IB of proteins in the control or OTUD3 knockdown THP-1 cells infected with HSV-1 for the indicated times by the indicated antibodies. ∗p < 0.05, ∗∗p < 0.01, and ∗∗∗p < 0.001, using two-way ANOVA with Holm-Sidak’s multiple comparisons test (A–D). Data based on one representative experiment performed in three biological replicates from at least three independent experiments (mean ± SD) or representative data (E). |
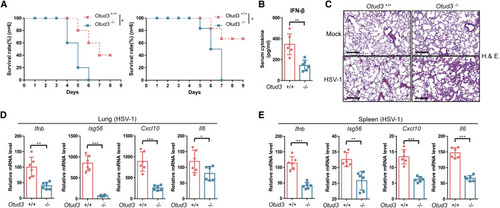
Figure 6. Otud3-deficient mice are susceptible to HSV infection (A) Survival (Kaplan-Meier curve) of Otud3+/+ and Otud3−/− mice (n = 6 per group) at various time after i.p. injection with HSV (1 × 10⁷ PFU per mouse). (B) ELISA of IFN-β in serum from Otud3+/+ and Otud3−/− mice (n = 6) given i.p. injection of HSV-1 (1 × 10⁷ PFU per mouse) for 24 h. (C) Microscopy of H&E-stained lung sections from Otud3+/+ and Otud3−/− mice treated with PBS (mock) or HSV-1 (1 × 10⁷ PFU per mouse) for 48 h. Scale bar, 300 μm. (D and E) qRT-PCR analysis of Ifn-b, Isg56, Cxcl10, and Il6 in the lungs (D, n = 6) and spleen (E, n = 6) from Otud3+/+ and Otud3−/− mice given i.p. injection of HSV-1 (1 × 10⁷ PFU per mouse) for 48 h. ∗p < 0.05, ∗∗p < 0.01, and ∗∗∗p < 0.001, using unpaired Student’s t test (B, D, and E) or log rank (Mantel-Cox) test (A). Data based on one representative experiment performed in three biological replicates from at least three independent experiments (mean ± SD) or representative data (C). |
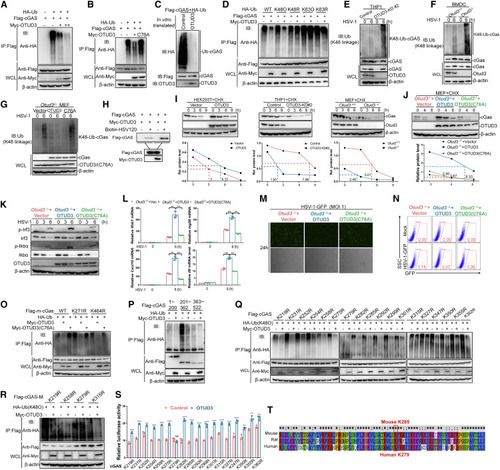
Figure 7. OTUD3 deubiquitinates cGAS at Lys279 by removing K48-linked ubiquitin chain (A) IB for polyubiquitination of cGAS in HEK293T cells transfected with the indicated expression plasmids, FLAG-cGAS, HA-Ub, and increasing amount of Myc-OTUD3, and followed by immunoprecipitating with anti-FLAG beads. (B) IB for polyubiquitination of cGAS in HEK293T cells transfected the indicated expression plasmids, FLAG-cGAS, HA-Ub, and Myc-OTUD3 or Myc-OTUD3 (C76A) (an enzymatic inactive form of OTUD3) for 24 h, followed by pull-down assays with anti-FLAG antibody-conjugated agarose beads. (C) IB for polyubiquitination of cGAS in vitro. Ubiquitinated cGAS was eluted from anti-FLAG precipitated-HEK293T cell lysates transfected with FLAG-cGAS (5 μg) and HA-ubiquitin (5 μg), which were incubated with in vitro-translated OTUD3 or empty control. (D) IB for polyubiquitination of cGAS in HEK293T cells transfected with the indicated expression plasmids, FLAG-cGAS, HA-tagged ubiquitin (WT-Ub), or HA-tagged K48-only ubiquitin (K48O), or HA-tagged K63-only ubiquitin (K63O), or HA-tagged K48R ubiquitin (K48R), or HA-tagged K63R ubiquitin (K63R), together with the empty vector or Myc-OTUD3, followed by immunoprecipitating with anti-FLAG antibody-conjugated agarose beads. (E) IB for endogenous polyubiquitination of cGAS in the control and OTUD3-knockdown THP-1 cells infected with HSV-1 for 6 h. (F) IB for endogenous polyubiquitination of cGAS in Otud3+/+ and Otud3−/− BMDCs (1 × 10⁸) infected with HSV-1 for 6 h. (G) IB for endogenous K48-linked polyubiquitination of cGAS in Otud3−/− MEFs reconstituted with the empty vector, OTUD3, or OTUD3 (C76A) followed by the un-infection or infection of HSV-1 for 6 h. (H) The effect of OTUD3 on the binding ability of cGAS to dsDNA. HEK293T cells were transfected with the indicated plasmids for 20 h. The cell lysates were then incubated with biotinylated HSV120 and streptavidin-Sepharose beads. The bead-bound proteins were analyzed by immunoblotting with the indicated antibodies. (I) IB of cGAS, OTUD3, and β-actin (upper blots) and quantitative analysis of the intensity of cGAS (relative to β-actin) (lower graphs) in HEK293T cells, THP-1, and MEFs in the presence or absence of CHX for 0–9 h. (J) IB of cGAS, OTUD3, and β-actin (left blots) and quantitative analysis of the intensity of cGAS (relative to β-actin) (right graphs) in Otud3−/− MEFs reconstituted with the empty vector, OTUD3, or OTUD3 (C76A) in the presence or absence of CHX for 0–8 h. (K) IB of proteins in Otud3−/− MEFs reconstituted with the empty vector, OTUD3, or OTUD3 (C76A) followed by the un-infection or infection of HSV-1 for the indicated times. (L) qRT-PCR analysis of Ifnb1, Isg56, Cxcl10, and Il6, in Otud3−/− MEFs reconstituted with the empty vector, OTUD3, or OTUD3 (C76A), followed by the infection of HSV-1 for 0–6 h. (M and N) Fluorescent microscopy imaging and flow cytometry analysis of the replication of HSV-GFP in Otud3−/− MEFs reconstituted with the empty vector, OTUD3, or OTUD3 (C76A) followed by HSV-GFP challenge (1 MOI) for 24 h. (O) IB for polyubiquitination of mouse cGAS (m-GAS) or mouse cGAS mutants (K271R and K464R) in HEK293T cells transfected with the indicated expression plasmids, HA-Ub, FLAG-mouse-cGAS (m-cGAS), or FLAG-mouse-cGAS mutants (K271R and K464R) together with empty vector, Myc-OTUD3, or Myc-OTUD3 (C76A) for 24 h followed by immunoprecipitating with anti-FLAG antibody-conjugated agarose beads. (P) IB for polyubiquitination of cGAS domains in HEK293T cells transfected with the indicated expression plasmids, FLAG-tagged truncated cGAS mutants (1–200 aa, 201–362 aa (M) and 363–522 aa), together with FLAG-MDA5, Myc-OTUD3, and HA-ubiquitin for 24 h followed by immunoprecipitating with anti-FLAG antibody-conjugated agarose beads. (Q) IB for K48-linked polyubiquitination of various mutants of cGAS in HEK293T cells transfected with the indicated expression plasmids, Myc- OTUD3, HA-Ub (K48O), or FLAG-tagged cGAS mutants (in which lysine was substituted with arginine individually) for 24 h followed by immunoprecipitating with anti-FLAG antibody-conjugated agarose beads. (R) IB for K48-linked polyubiquitination of four mutants of cGAS in HEK293T cells transfected with the indicated expression plasmids, Myc-OTUD3, HA-Ub (K48O), or FLAG-tagged cGAS domain (FLAG-cGAS-M) mutants (K219R, K258R, K279R, or K315R) for 24 h followed by immunoprecipitating with anti-FLAG antibody-conjugated agarose beads. (S) Luciferase activity of IFN-β promoter luciferase reporter in HEK293T cells transfected FLAG-cGAS mutants together with Myc-OTUD3. (T) Alignment of amino acid sequences around human Lys279 from mouse, rat, and human. The conserved lysine residue is circled by a red rectangle. ns, no significance, ∗p < 0.05, ∗∗p < 0.01, and ∗∗∗p < 0.001, using unpaired Student’s t test (G) or two-way ANOVA with Holm-Sidak’s multiple comparisons test (I, M, and T). Data based on one representative experiment performed in three biological replicates from at least three independent experiments (mean ± SD) or representative data (A–F, H, J–L, and N–S). |

ZFIN is incorporating published figure images and captions as part of an ongoing project. Figures from some publications have not yet been curated, or are not available for display because of copyright restrictions. EXPRESSION / LABELING:
PHENOTYPE:
|
|
ZFIN is incorporating published figure images and captions as part of an ongoing project. Figures from some publications have not yet been curated, or are not available for display because of copyright restrictions. PHENOTYPE:
|