
|
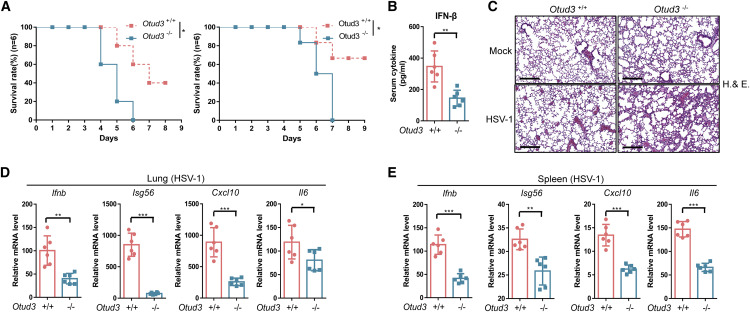
Fig. 6 Figure 6. Otud3-deficient mice are susceptible to HSV infection (A) Survival (Kaplan-Meier curve) of Otud3+/+ and Otud3−/− mice (n = 6 per group) at various time after i.p. injection with HSV (1 × 10⁷ PFU per mouse). (B) ELISA of IFN-β in serum from Otud3+/+ and Otud3−/− mice (n = 6) given i.p. injection of HSV-1 (1 × 10⁷ PFU per mouse) for 24 h. (C) Microscopy of H&E-stained lung sections from Otud3+/+ and Otud3−/− mice treated with PBS (mock) or HSV-1 (1 × 10⁷ PFU per mouse) for 48 h. Scale bar, 300 μm. (D and E) qRT-PCR analysis of Ifn-b, Isg56, Cxcl10, and Il6 in the lungs (D, n = 6) and spleen (E, n = 6) from Otud3+/+ and Otud3−/− mice given i.p. injection of HSV-1 (1 × 10⁷ PFU per mouse) for 48 h. ∗p < 0.05, ∗∗p < 0.01, and ∗∗∗p < 0.001, using unpaired Student’s t test (B, D, and E) or log rank (Mantel-Cox) test (A). Data based on one representative experiment performed in three biological replicates from at least three independent experiments (mean ± SD) or representative data (C).