
FIGURE SUMMARY
- Title
-
Multimodal Characterization of Seizures in Zebrafish Larvae
- Authors
- Turrini, L., Sorelli, M., de Vito, G., Credi, C., Tiso, N., Vanzi, F., Pavone, F.S.
- Source
- Full text @ Biomedicines
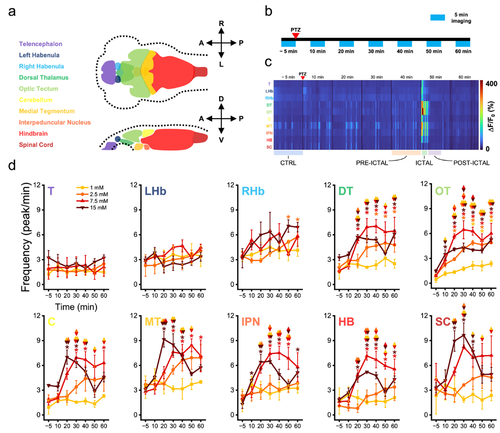
Figure 1. Zebrafish brain regions present different susceptibility to convulsant effects. (a) Dorsal (upper) and lateral (lower) schemes representing in different colors the ten brain districts into which volumetric calcium imaging data were segmented for further analysis. Dotted lines show the outer larval boundaries. A: anterior; P: posterior; R: right; L: left; D: dorsal; V: ventral. (b) Scheme representing the brain functional imaging protocol adopted. After PTZ treatment, larvae were imaged for 5 min every 10, along 60 min. (c) Map showing in color-code the neuronal activity (ΔF/F0) of one larva over time of each of the ten brain regions (colored as in panel (a)) along 60 min of seizure mapping. Warmer colors indicate higher activity. Below the map, the different brain activity regimes, discussed in Figure 2, are reported. (d) Plot showing for each of the ten brain regions (abbreviations and colors as in panel (c)) the frequency of activity peaks at different PTZ concentrations (1.0, 2.5, 7.5 and 15 mM, see legend for colors) over 60 min of activity monitoring. Values represent mean ± s.e.m. of n = 3 larvae per concentration. * indicates p-value < 0.05 for intra-group comparison with respect to control (−5 min) values, one-way repeated measures ANOVA and post hoc Tukey’s test (see Table S1 for p-values). Diamond symbol indicates p-value < 0.05 for inter-group comparison at the same time point, two-way repeated measures ANOVA and post hoc Tukey’s test (Table S2). Color couples in each symbol denote compared groups.
|
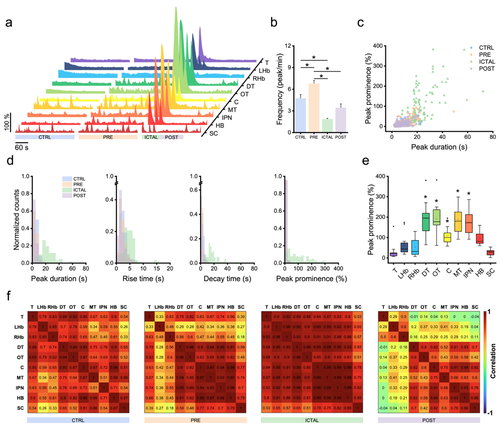
Figure 2. Zebrafish brain undergoes transition between different activity regimes during seizures. (a) ΔF/F0 traces of the ten larval brain regions (colored as in Figure 1) during four diverse activity regimes observed at maximal PTZ concentration (15 mM). CTRL (pre-exposure), PRE (preictal), ICTAL and POST (postictal). (b) Average frequency of activity peaks in the different regimes presented in panel (a). * indicates p-value < 0.05 for inter-regime comparison, one-way repeated measures ANOVA and post hoc Tukey’s test (for p-values see Table S3). Values represent mean ± s.e.m of n = 3 larvae per concentration. (c) Scatter plot showing peak duration as a function of peak prominence for each of the four regimes. (d) Normalized distributions of calcium transients’ kinetic features (peak duration, rise time, decay time and prominence) in each of the four activity regimes. For each parameter, all four distributions appear significantly different (two-samples K-S test with Bonferroni correction, α = 0.00833), except for peak prominence of CTRL vs. PRE and POST. For p-values, see Table S4. (e) Peak prominence during ictal regime for each of the ten brain regions. * indicates p-value < 0.00111 for inter-region comparison with telencephalon, two-samples K-S test with Bonferroni correction, α = 0.00111 (for p-values see Table S5). Box: IQR; error bar: 1.5 IQR; black line: median; white square: mean; black diamond: outlier. (f) Correlation matrices reporting average pairwise Pearson’s correlation coefficients of neuronal activity during the four regimes across the ten brain regions.
|
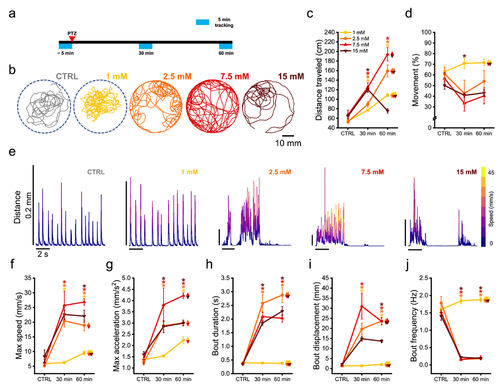
Figure 3. Zebrafish larvae undergo alteration of their swimming kinematic during seizures. (a) Scheme representing the behavioral tracking protocol adopted. The larvae were tracked along 5 min before the exposure to PTZ and 30–60 min after. (b) Swimming trajectories over 5 min of behavioral recording of one larva for each of the following conditions: pre-exposure (CTRL) and 60 min after the exposure to the different PTZ concentrations. (c,d) Average total distance traveled (c) and percentage of time spent in movement (d) in 5 min recording in the 3 different tracking windows (CTRL, 30 and 60 min), in larvae exposed to one of the four PTZ concentrations tested (see legend for colors). (e) Representative swimming bout shapes observed in each of the conditions reported, presented as larval displacement over time. Traces are color-mapped according to swimming velocity (warmer colors higher speed). (f–j) Average kinematic features of swimming bouts -maximum speed (f), maximum acceleration (g), duration (h), displacement (i) and frequency (j)—during 5-min recording epochs before PTZ exposure and 30–60 min after. * indicates p-value < 0.05 for intra-group comparison with respect to control (CTRL) values, one-way repeated measures ANOVA and post hoc Tukey’s test (for p-values see Table S6). Diamond symbol indicates p-value < 0.05 for inter-group comparison at 60 min exposure, two-way repeated measures ANOVA and post hoc Tukey’s test (for p-values see Table S7). Color couples in each symbol indicate groups compared. Values represent mean ± s.e.m. of n = 4 larvae per concentration.
|
Acknowledgments
This image is the copyrighted work of the attributed author or publisher, and
ZFIN has permission only to display this image to its users.
Additional permissions should be obtained from the applicable author or publisher of the image.
Full text @ Biomedicines