
Image
|
Figure Caption
Fig. 2
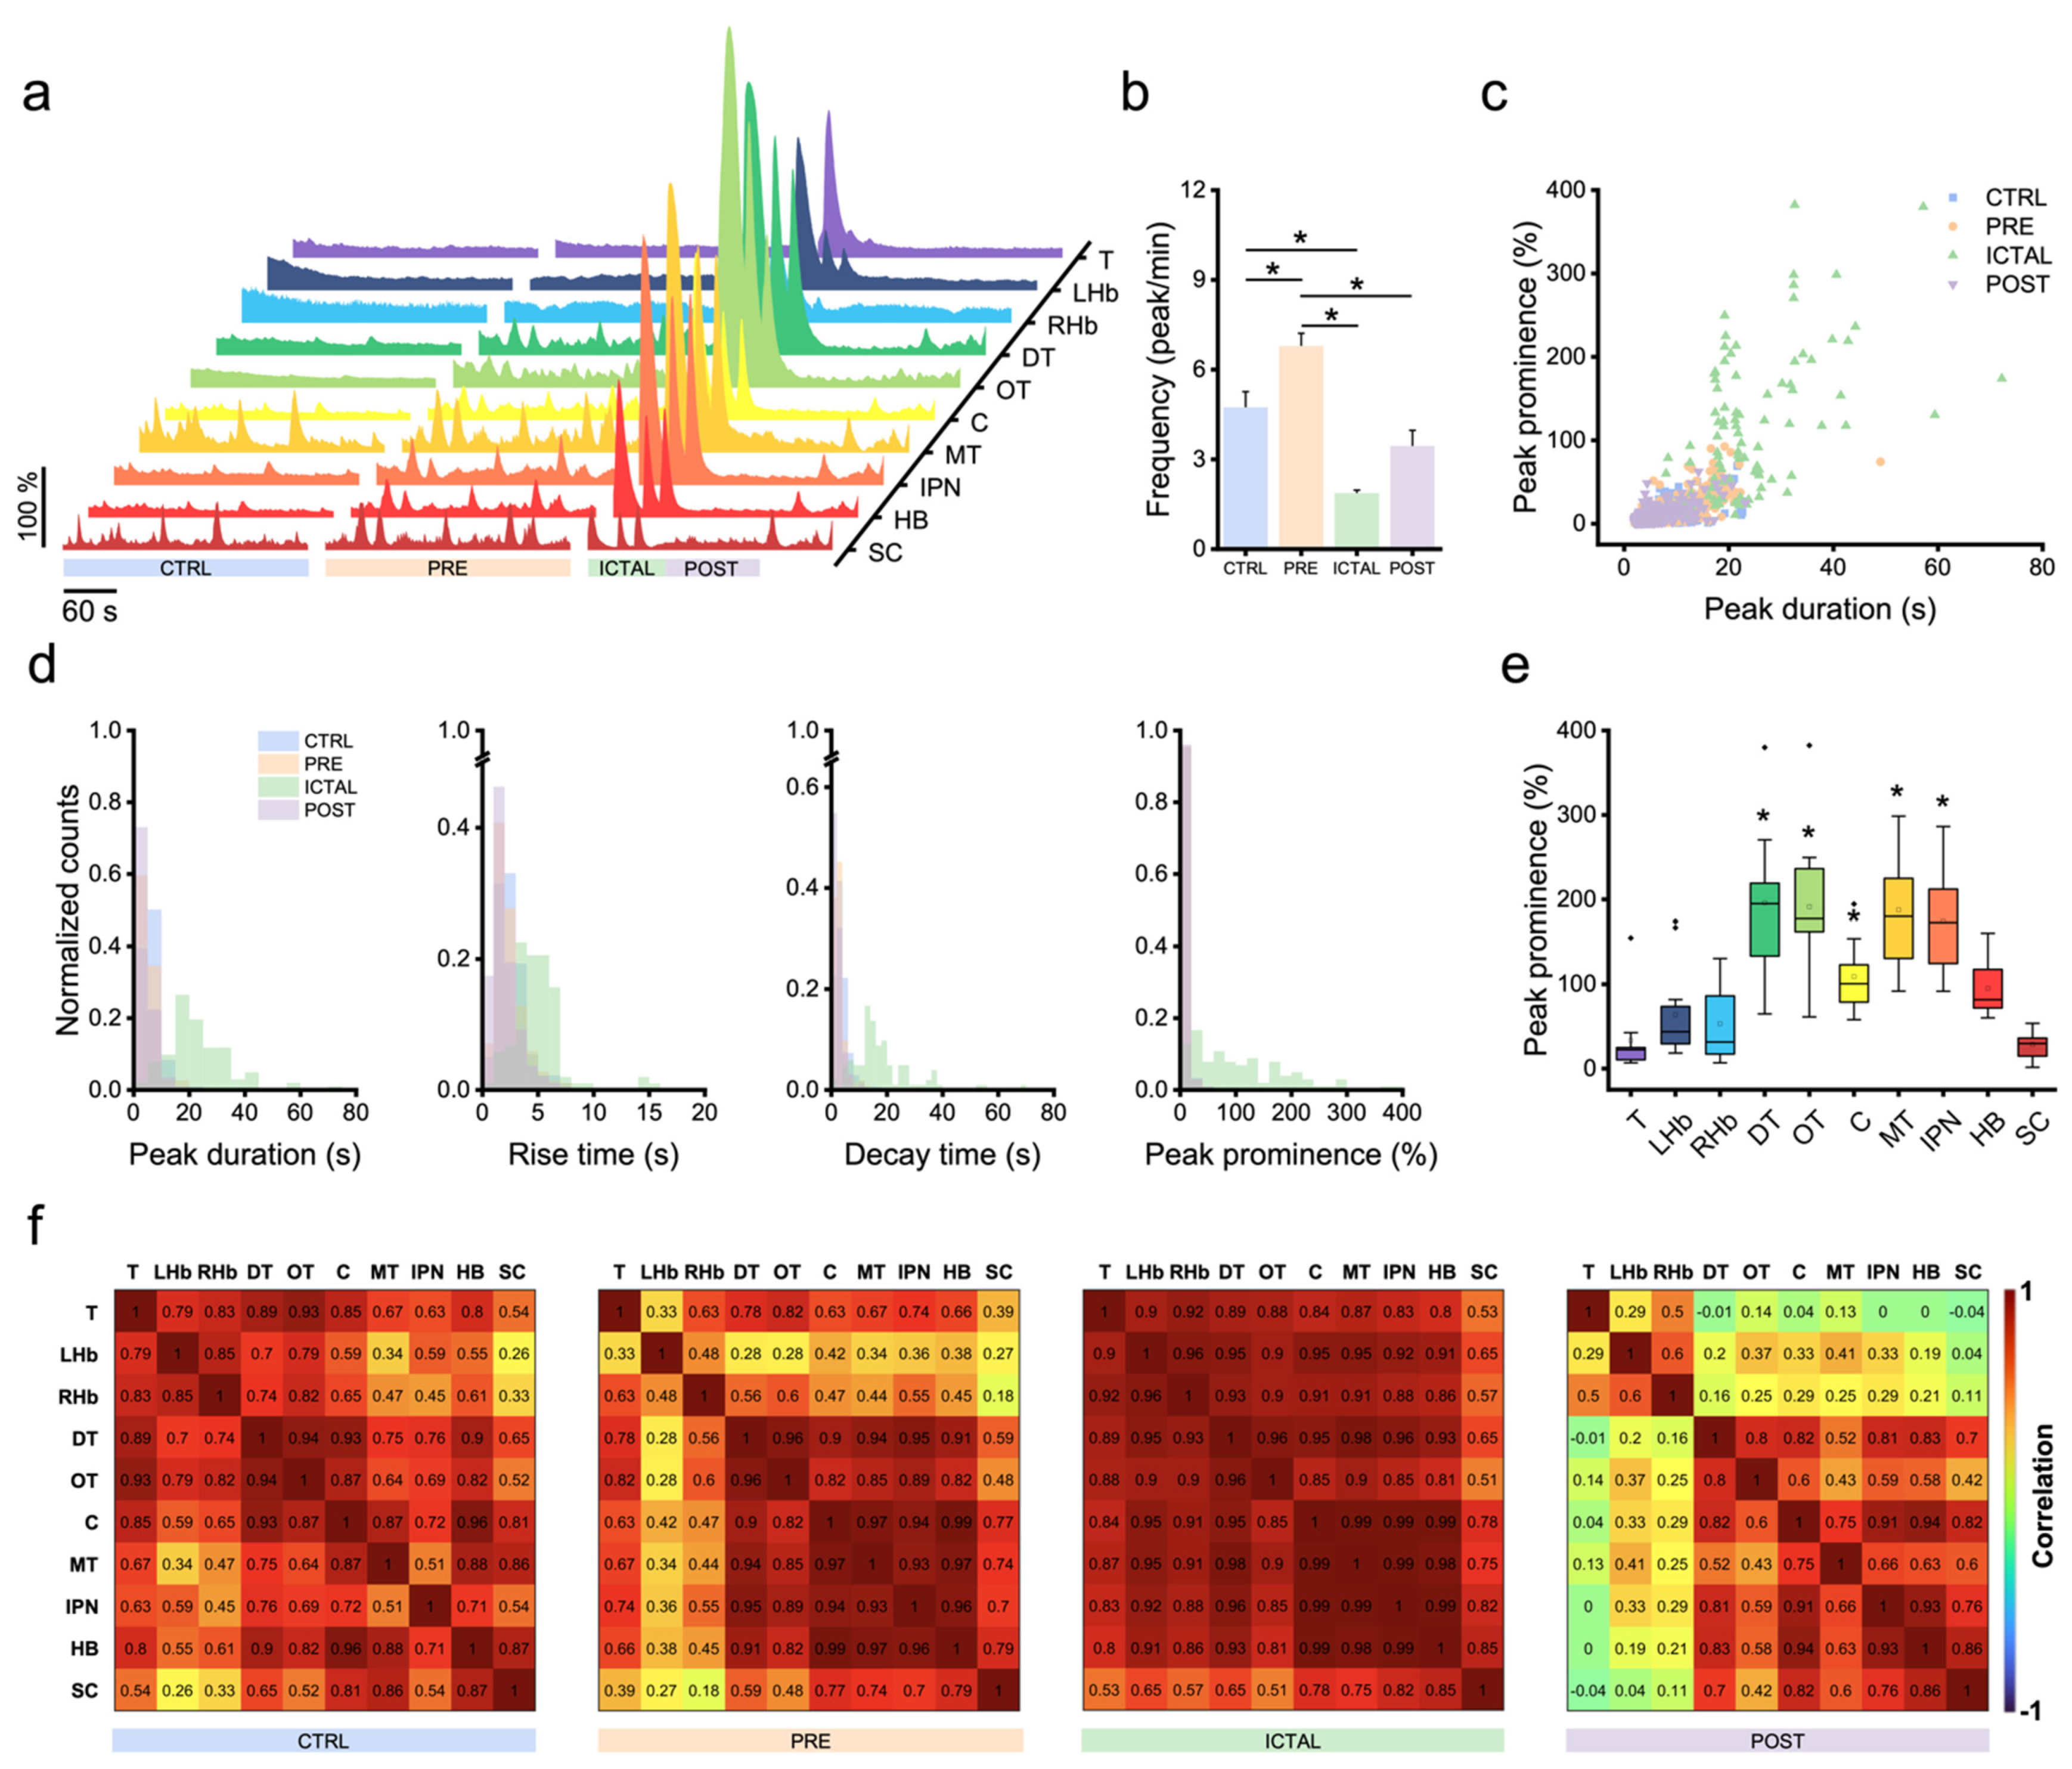
Figure 2. Zebrafish brain undergoes transition between different activity regimes during seizures. (a) ΔF/F0 traces of the ten larval brain regions (colored as in Figure 1) during four diverse activity regimes observed at maximal PTZ concentration (15 mM). CTRL (pre-exposure), PRE (preictal), ICTAL and POST (postictal). (b) Average frequency of activity peaks in the different regimes presented in panel (a). * indicates p-value < 0.05 for inter-regime comparison, one-way repeated measures ANOVA and post hoc Tukey’s test (for p-values see Table S3). Values represent mean ± s.e.m of n = 3 larvae per concentration. (c) Scatter plot showing peak duration as a function of peak prominence for each of the four regimes. (d) Normalized distributions of calcium transients’ kinetic features (peak duration, rise time, decay time and prominence) in each of the four activity regimes. For each parameter, all four distributions appear significantly different (two-samples K-S test with Bonferroni correction, α = 0.00833), except for peak prominence of CTRL vs. PRE and POST. For p-values, see Table S4. (e) Peak prominence during ictal regime for each of the ten brain regions. * indicates p-value < 0.00111 for inter-region comparison with telencephalon, two-samples K-S test with Bonferroni correction, α = 0.00111 (for p-values see Table S5). Box: IQR; error bar: 1.5 IQR; black line: median; white square: mean; black diamond: outlier. (f) Correlation matrices reporting average pairwise Pearson’s correlation coefficients of neuronal activity during the four regimes across the ten brain regions.
Acknowledgments
This image is the copyrighted work of the attributed author or publisher, and
ZFIN has permission only to display this image to its users.
Additional permissions should be obtained from the applicable author or publisher of the image.
Full text @ Biomedicines