
- Title
-
Brain Proteome and Behavioural Analysis in Wild Type, BDNF+/- and BDNF-/- Adult Zebrafish (Danio rerio) Exposed to Two Different Temperatures
- Authors
- Maffioli, E., Angiulli, E., Nonnis, S., Grassi Scalvini, F., Negri, A., Tedeschi, G., Arisi, I., Frabetti, F., D'Aniello, S., Alleva, E., Cioni, C., Toni, M.
- Source
- Full text @ Int. J. Mol. Sci.
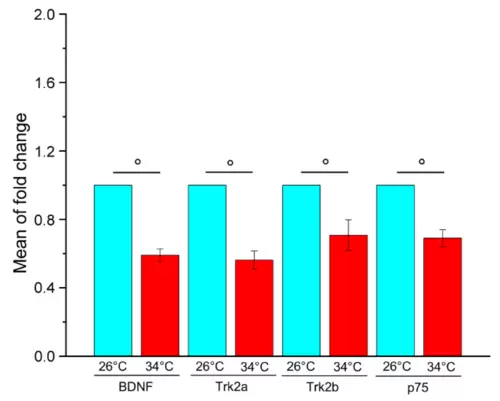
Relative quantification of BDNF, Trk2a, Trk2b and p75 gene expression in the brain of adult WT zebrafish kept at 26 °C and 34 °C for 21 days. For each gene, the expression level at 26 °C was set to 1. The expression levels were normalised against tubulin and expressed as fold change relative to samples at 26 °C. Data are expressed as mean ± SEM and analysed with an unpaired |
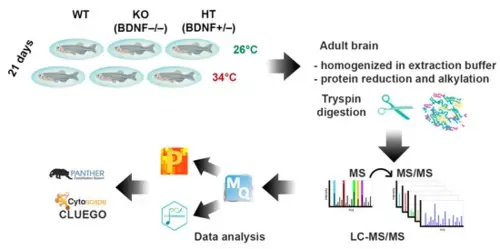
Figure 2. Cartoon of the workflow of the proteomic analysis of the brains of adult zebrafish kept for 21 days at 26 °C and 34 °C. |
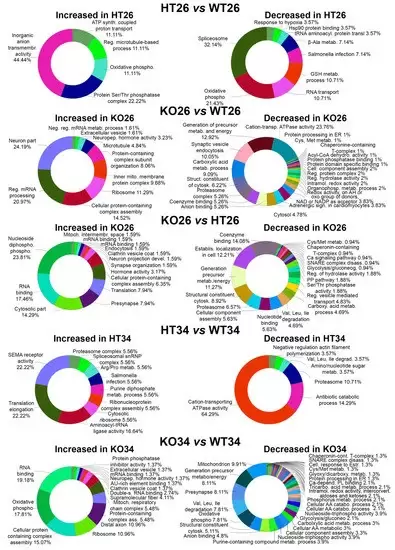
Figure 3. Bioinformatic analysis by ClueGo of the proteins differentially or exclusively expressed in HT26 vs. WT26, KO26 vs. WT26, KO26 vs. HT26, HT34 vs. WT34, KO34 vs. WT34. Bioinformatic analyses were carried out by ClueGo software (Cytoskape release 3.8.2) to cluster enriched annotation groups of biological processes, pathways, and networks within the set of differentially expressed or exclusively expressed proteins in the comparisons. Functional grouping was based on p ≤ 0.05. Functional grouping was based on p ≤ 0.05 and at least three counts.
|
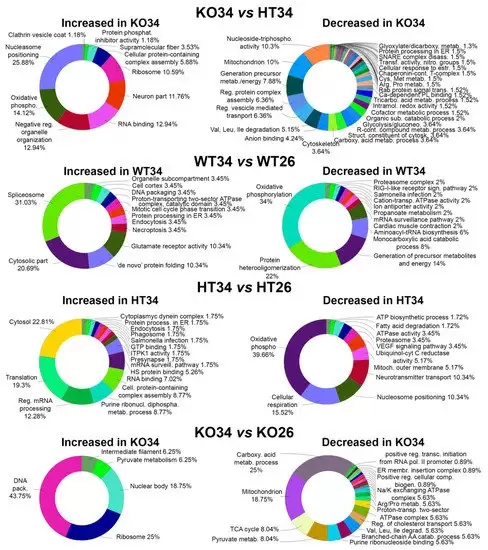
Figure 4. Bioinformatic analysis by ClueGo of the proteins differentially or exclusively expressed in KO34 vs. HT34, WT34 vs. WT26, HT34 vs. HT26, KO34 vs. KO26. Bioinformatic analyses were carried out by ClueGo software (Cytoskape release 3.8.2) to cluster enriched annotation groups of biological processes, pathways, and networks within the set of differentially expressed or exclusively expressed proteins in the comparisons. Functional grouping was based on p ≤ 0.05. Functional grouping was based on p ≤ 0.05 and at least three counts.
|
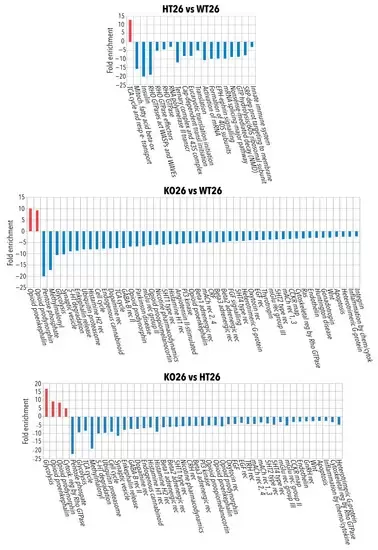
Figure 5. Panther pathways analysis of the proteins differentially or exclusively expressed in HT26 vs. WT26, KO26 vs. WT26 and KO26 vs. HT26. Bioinformatic analyses were conducted by Panther software (release 16.0) to cluster enriched Panther pathway within the set of differentially expressed or exclusively expressed proteins in HT26 vs. WT26, KO26 vs. WT26 and KO26 vs. HT26. If any Panther pathways enrichment was found, the data were processed by Panther Reactome to find Reactome GO and pathways enrichment. Functional grouping was based on Fischer’s exact test p ≤ 0.05 and at least three counts.
|
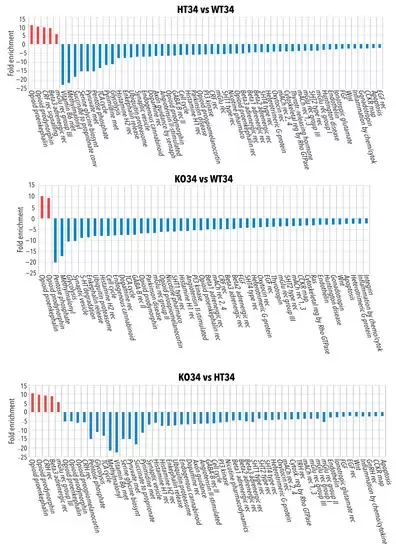
Figure 6. Panther pathways analysis of the proteins differentially or exclusively expressed in HT34 vs. WT34, KO34 vs. WT34 and KO34 vs. HT34. Bioinformatic analyses were conducted by Panther software (release 16.0) to cluster enriched Panther pathway within the set of differentially expressed or exclusively expressed proteins in HT34 vs. WT34, KO34 vs. WT34 and KO34 vs. HT34. If any Panther pathways enrichment was found, the data were processed by Panther Reactome to find Reactome GO and pathways enrichment. Functional grouping was based on Fischer’s exact test p ≤ 0.05 and at least three counts.
|
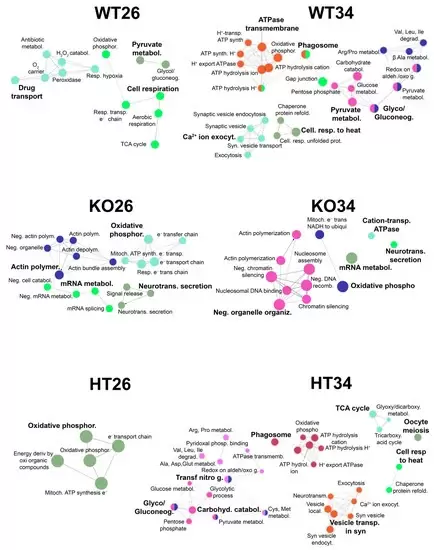
Figure 7. Functional analysis by ClueGo of the proteins most differentiated comparing each data set (WT26, WT34, KO26, KO34, HT26, HT34) with all the others. All data sets were analysed using R-Bioconductor: LFQ data were normalised to the median and analysed for differential expression by the limma package, choosing |Log2FC| > 0.585 and FDR < 0.05 as differential thresholds for the limma test. Each data set was compared with all the others, and the proteins most differentiated were analysed by ClueGo. Functional grouping was based on Fischer’s exact test p ≤ 0.05.
|
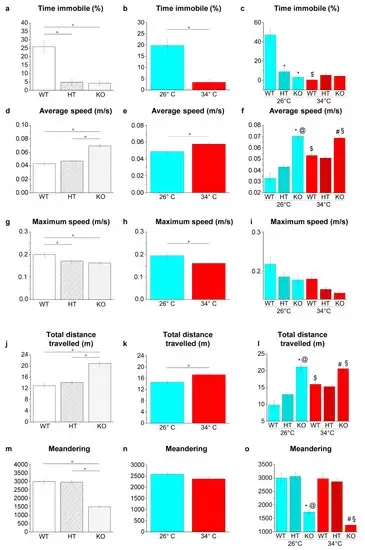
Figure 8. Swimming behaviour and locomotor activities in YMT. (a–c) Time immobile expressed as percentage of total time; (d–f) average speed; (g–i) maximum speed, (j–l) total distance travelled; (m–o) meandering. The data are expressed as means ± S.E.M. and analysed by two-way ANOVA with Bonferroni post hoc correction. p ≤ 0.05, °; *, HT26 vs. WT26 or KO26 vs. WT26; @, KO26 vs. HT26; #, HT34 vs. WT34 or KO34 vs. WT34; §, KO34 vs. HT34; $, WT34 vs. WT26, HT34 vs. HT26 or KO34 vs. KO26. p values and symbols used in the figure are shown in Table S21. N = 14. Blue and red colours refer to 26 °C and 34 °C, respectively.
|
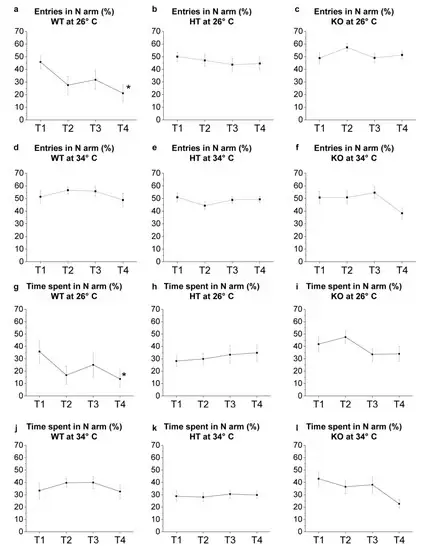
Figure 9. YMT: novel environment exploration T1–T4. (a–f) Number of entries in N arm expressed as percentage of total entries in Y-maze arms; (g–l) time spent in N arm expressed as percentage of total time performed by WT (a,d,g,j), HT (b,e,h,k) and KO (c,f,i,l) at 26 °C (a–c,g–i) or 34 °C (d–f,j–l). The data were analysed by one-way repeated measures ANOVA with post hoc Bonferroni correction. p ≤ 0.05, *, compared to T1. p values are reported in Table S22. N = 14. |
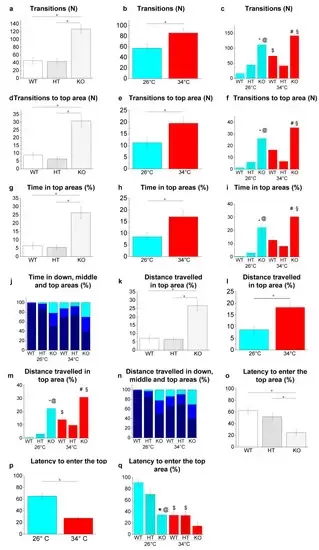
Figure 10. Novel environment exploration behaviour in the NTT. (a–c) Transitions among areas; (d–f) transitions to top area; (g–i) time spent in the top area expressed as a percentage of the total time; (j) time spent in the three vertical virtual areas of the tank expressed as a percentage of the total time; (k–m) distance travelled in the top area expressed as a percentage of the total distance travelled, (n) distance travelled in the three vertical virtual areas of the tank expressed as a percentage of the total distance travelled; (o–q) latency to enter the top area. The data are expressed as means ± S.E.M. and analysed by two-way ANOVA with Bonferroni post hoc correction. p ≤ 0.05, °; *, HT26 vs. WT26 or KO26 vs. WT26; @, KO26 vs. HT26; #, HT34 vs. WT34 or KO34 vs. WT34; §, KO34 vs. HT34; $, WT34 vs. WT26, HT34 vs. HT26 or KO34 vs. KO26. p values and symbols used in the figure are shown in Table S23. N = 20. In panels J and N, dark blue, blue and light blue colours refer respectively to bottom, middle and top areas of the tank. In all other panels, blue and red colours refer to 26 °C and 34 °C, respectively.
|
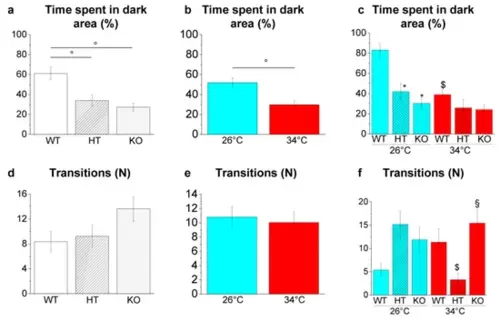
Figure 11. Scototaxis behaviour in the LDT. (a–c) Time spent in the dark area; (d–f) number of passages between the bright and dark areas. The data are expressed as mean ± S.E.M. and analysed by two-way ANOVA with Bonferroni post hoc correction. p ≤ 0.05, °; *, HT26 vs. WT26 or KO26 vs. WT26; §, KO34 vs. HT34; $, WT34 vs. WT26, HT34 vs. HT26 or KO34 vs. KO26. p values and symbols used in the figure are shown in Table S24. N = 20. Blue and red colours refer to 26 °C and 34 °C, respectively.
|
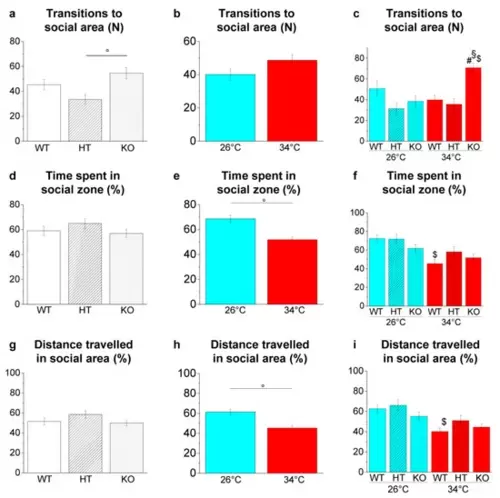
Figure 12. Shoaling behaviour in the SPT. (a–c) Number of entries in the social area; (d–f) time spent in the social area expressed as percentage of total time; (g–i) total distance travelled in the social area expressed as percentage of total time. The data are expressed as mean ± S.E.M. and analysed by two-way ANOVA with Bonferroni post hoc correction. p ≤ 0.05, °; #, HT34 vs. WT34 or KO34 vs. WT34; §, KO34 vs. HT34; $, WT34 vs. WT26, HT34 vs. HT26 or KO34 vs. KO26. p values and symbols used in the figure are shown in Table S25. N = 20. Blue and red colours refer to 26 °C and 34 °C, respectively.
|
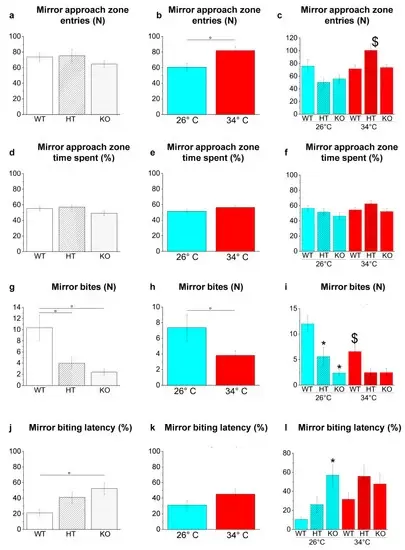
Figure 13. Aggressive behaviour in the MBT. (a–c) Entries in mirror approach area; (d–f) time spent in mirror approach area expressed as percentage of total time; (g–i) mirror bites; (j–l) mirror-biting latency. The data are expressed as mean ± S.E.M. and analysed by two-way ANOVA with Bonferroni post hoc correction. p ≤ 0.05, °; *, HT26 vs. WT26 or KO26 vs. WT26; $, WT34 vs. WT26, HT34 vs. HT26 or KO34 vs. KO26. p values and symbols used in the figure are shown in Table S26. N = 14. Blue and red colours refer to 26 °C and 34 °C, respectively.
|