
Image
|
Figure Caption
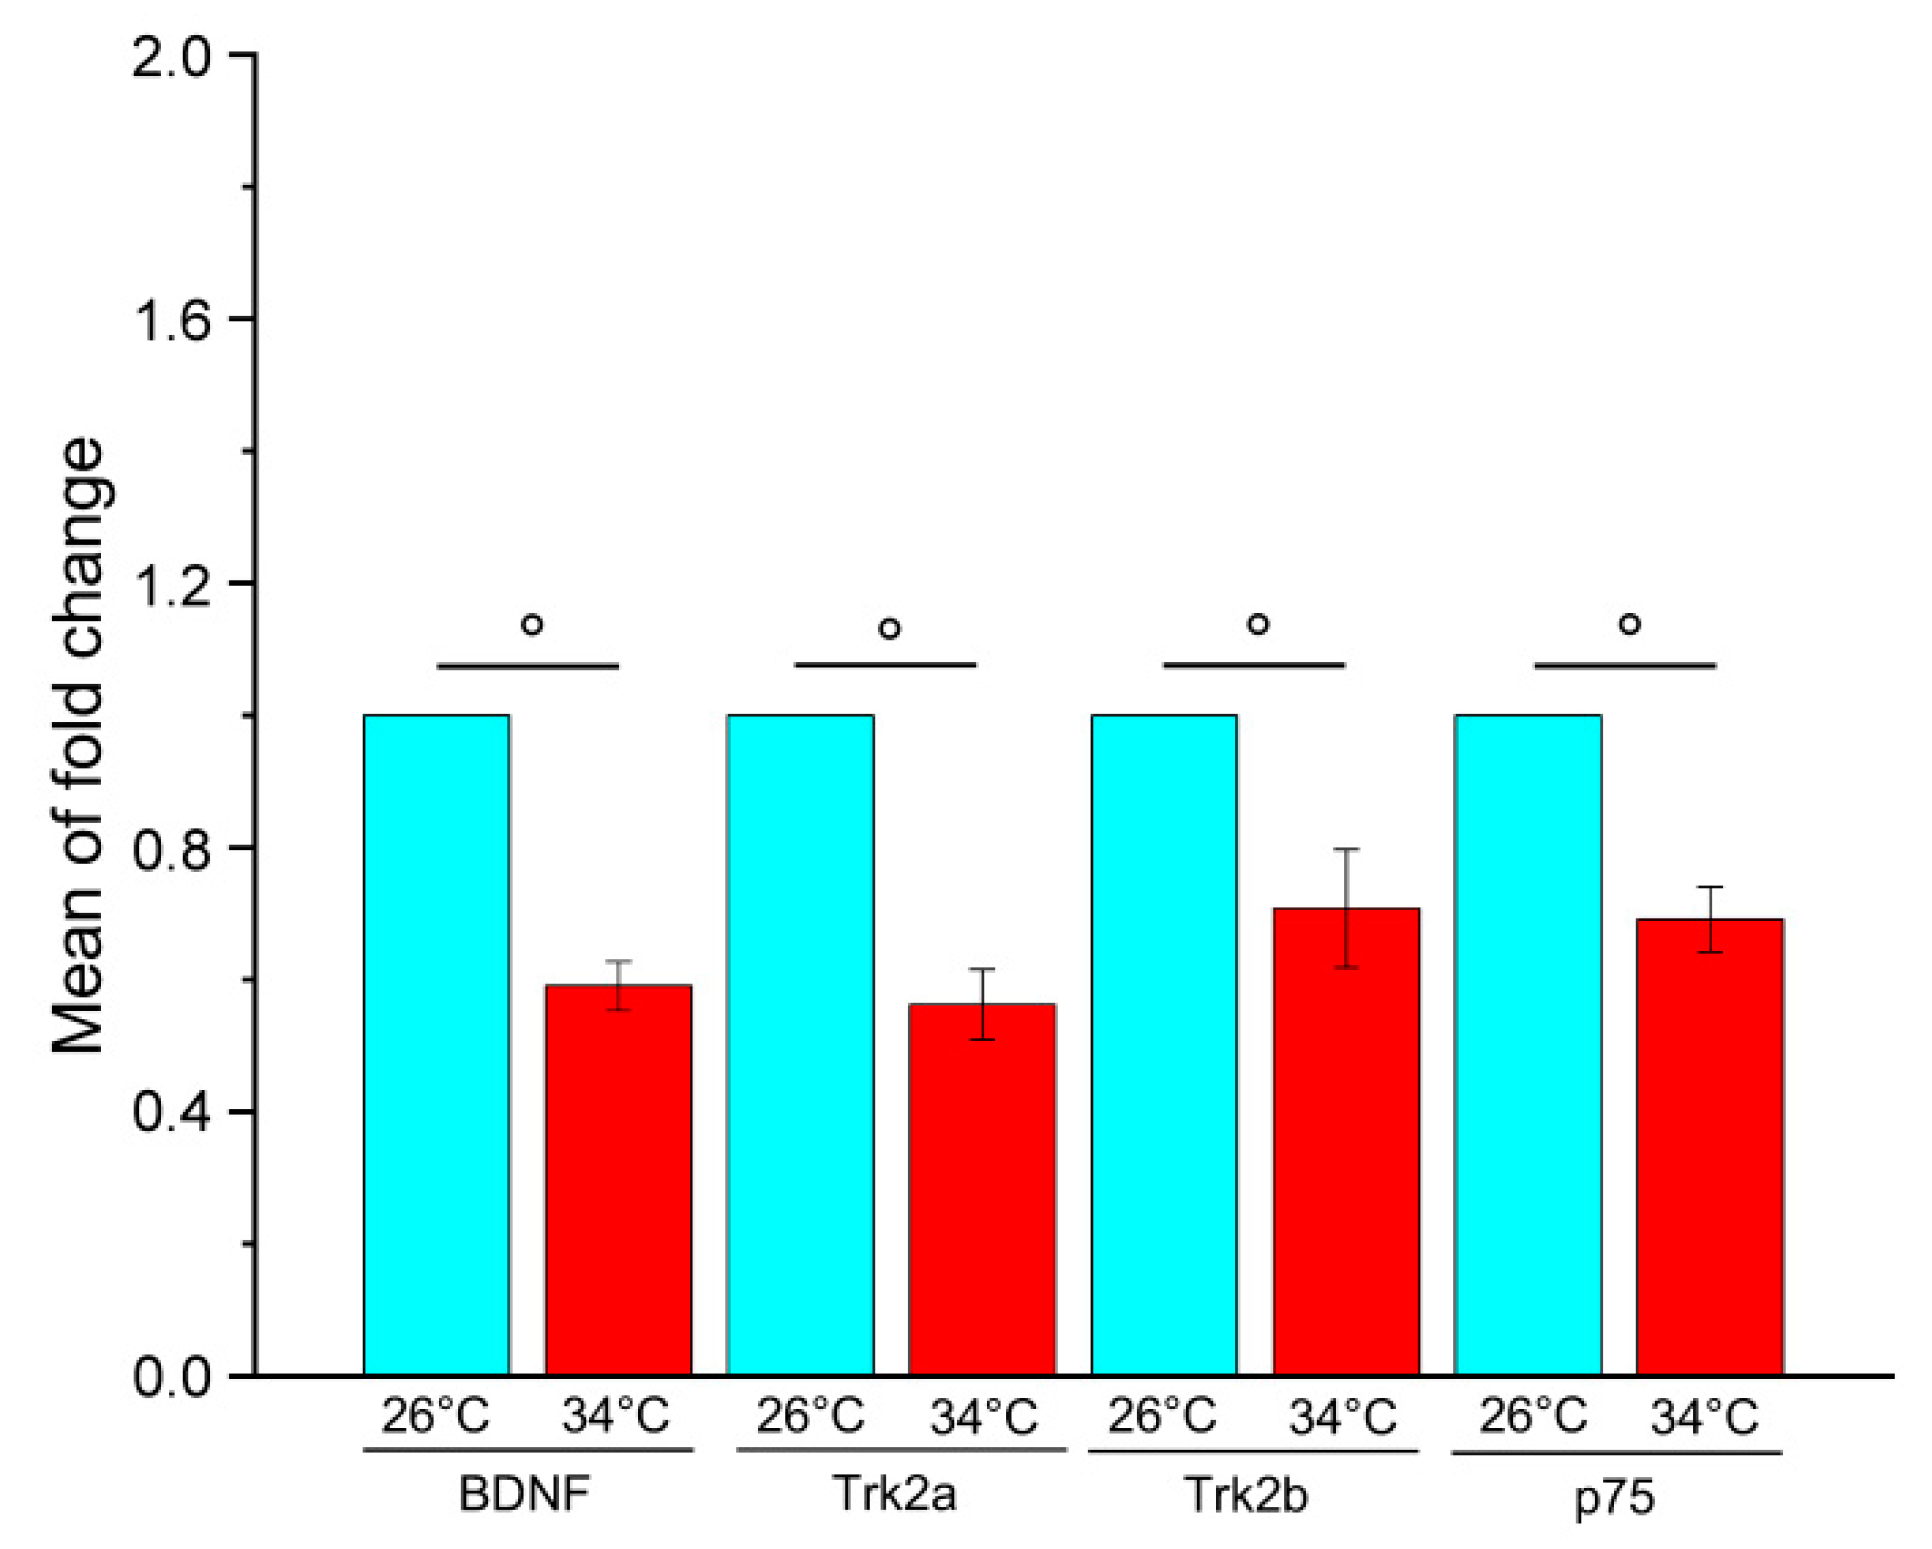
Fig. 1
Relative quantification of BDNF, Trk2a, Trk2b and p75 gene expression in the brain of adult WT zebrafish kept at 26 °C and 34 °C for 21 days. For each gene, the expression level at 26 °C was set to 1. The expression levels were normalised against tubulin and expressed as fold change relative to samples at 26 °C. Data are expressed as mean ± SEM and analysed with an unpaired
Acknowledgments
This image is the copyrighted work of the attributed author or publisher, and
ZFIN has permission only to display this image to its users.
Additional permissions should be obtained from the applicable author or publisher of the image.
Full text @ Int. J. Mol. Sci.