
Image
|
Figure Caption
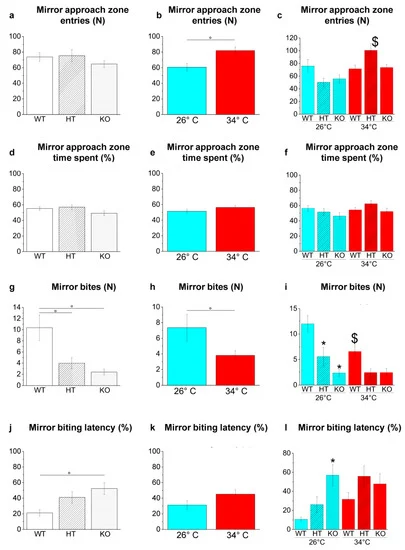
Fig. 13
Figure 13. Aggressive behaviour in the MBT. (a–c) Entries in mirror approach area; (d–f) time spent in mirror approach area expressed as percentage of total time; (g–i) mirror bites; (j–l) mirror-biting latency. The data are expressed as mean ± S.E.M. and analysed by two-way ANOVA with Bonferroni post hoc correction. p ≤ 0.05, °; *, HT26 vs. WT26 or KO26 vs. WT26; $, WT34 vs. WT26, HT34 vs. HT26 or KO34 vs. KO26. p values and symbols used in the figure are shown in Table S26. N = 14. Blue and red colours refer to 26 °C and 34 °C, respectively.
Acknowledgments
This image is the copyrighted work of the attributed author or publisher, and
ZFIN has permission only to display this image to its users.
Additional permissions should be obtained from the applicable author or publisher of the image.
Full text @ Int. J. Mol. Sci.