
Image
|
Figure Caption
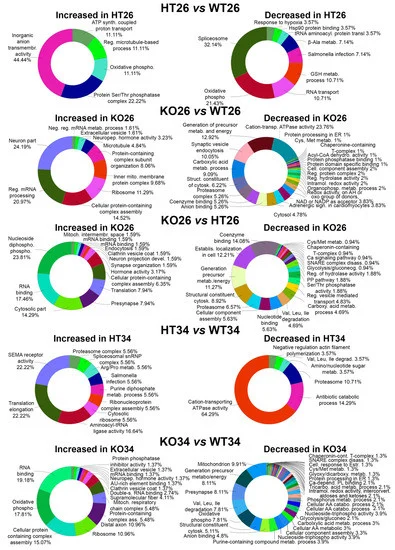
Fig. 3
Figure 3. Bioinformatic analysis by ClueGo of the proteins differentially or exclusively expressed in HT26 vs. WT26, KO26 vs. WT26, KO26 vs. HT26, HT34 vs. WT34, KO34 vs. WT34. Bioinformatic analyses were carried out by ClueGo software (Cytoskape release 3.8.2) to cluster enriched annotation groups of biological processes, pathways, and networks within the set of differentially expressed or exclusively expressed proteins in the comparisons. Functional grouping was based on p ≤ 0.05. Functional grouping was based on p ≤ 0.05 and at least three counts.
Acknowledgments
This image is the copyrighted work of the attributed author or publisher, and
ZFIN has permission only to display this image to its users.
Additional permissions should be obtained from the applicable author or publisher of the image.
Full text @ Int. J. Mol. Sci.