
- Title
-
Chemogenetic Depletion of Hypophysiotropic GnRH Neurons Does Not Affect Fertility in Mature Female Zebrafish
- Authors
- Tanaka, S., Zmora, N., Levavi-Sivan, B., Zohar, Y.
- Source
- Full text @ Int. J. Mol. Sci.
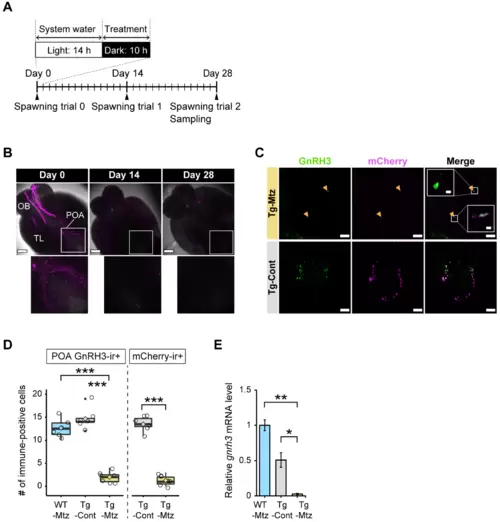
GnRH3 neuronal ablation is validated in the brain at 28 days of treatment. ( |

GnRH3 neuronal projections are reduced at 28 days of treatment in the pituitary of GnRH3 neuron-ablated females. ( |
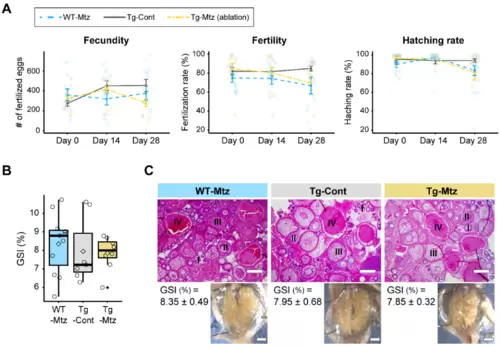
GnRH3 neuron-ablated females exhibit normal fertility. ( |

No correlation is observed between the number of detectable POA GnRH3 neurons and each reproductive parameter at 28 days of treatment. ( |
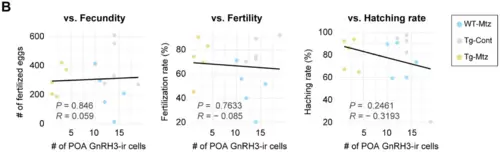
No correlation is observed between the number of detectable POA GnRH3 neurons and each reproductive parameter at 28 days of treatment. ( |

Schematic diagram of the different possible pathways in inducing the pre-ovulatory LH surge along the HPG axis in female zebrafish. In general, the accepted dogma is that the hypophysiotropic GnRH and its neurons are critical for LH surge, and ultimately oocyte maturation, ovulation, and spawning ( |