
- Title
-
Dawn and dusk peaks of outer segment phagocytosis, and visual cycle function require Rab28
- Authors
- Moran, A.L., Carter, S.P., Kaylor, J.J., Jiang, Z., Broekman, S., Dillon, E.T., Gómez Sánchez, A., Minhas, S.K., van Wijk, E., Radu, R.A., Travis, G.H., Carey, M., Blacque, O.E., Kennedy, B.N.
- Source
- Full text @ FASEB J.
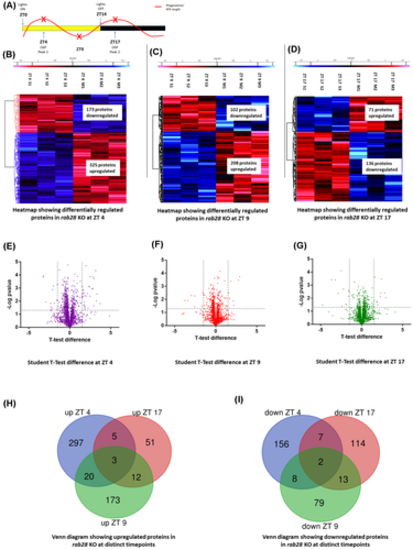
rab28 knockout zebrafish have altered proteome profiles (A) Time course highlighting sample collection time (red x) in relation to phagosome level fluctuation. (B–D) Heat maps representing the differentially expressed proteins between 2 months post fertilization wild-type siblings and rab28−/− at ZT 4, ZT 9 and ZT 17 respectively, illustrating proteins significantly upregulated (in red) or downregulated (in blue), given a cut-off of −log p-value ≥1.3. Student's t test was used for statistical analysis (N = 3). (E–G) Volcano plot representing differentially expressed proteins between wild-type siblings and rab28−/− given a fold change cut-off of ±1.2 and −log p-value ≥1.3. Student's t test was used for statistical analysis. (H,I) Venn diagram representing common and mutually exclusive proteins upregulated (H) and downregulated (I) between rab28 KO and wild-type siblings at ZT 4, ZT 9, and ZT 17
|
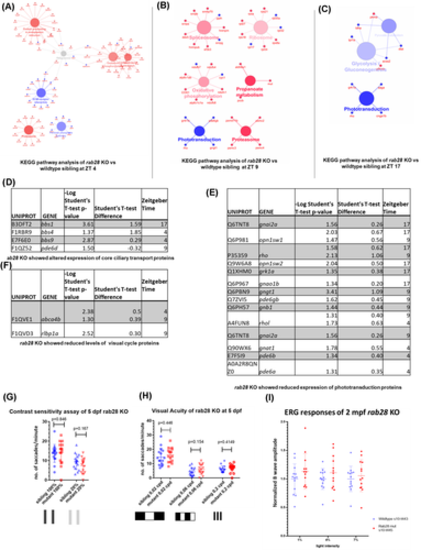
Pathway analysis of the altered protein profile of rab28 KO shows reduced levels of core ciliary trafficking and phototransduction components (A–C) KEGG pathway analysis of significantly downregulated (blue) and upregulated (red) proteins in rab28−/− compared with wild-type siblings at outer segment phagocytosis peaks and trough (D–F) Tables describing significantly downregulated and upregulated proteins associated with core ciliary trafficking components (D), phototransduction (E) and the visual cycle (F), respectively. Statistical analysis was carried out using a student's t test. (G) Scatter plot of visual behavior-based contrast sensitivity of rab28−/− larvae at 5 days post fertilization (dpf). Data are from three independent replicates. At least 16 larvae were tested per genotype for each assay. (H) Scatter plot of visual behavior-based visual acuity of rab28−/− larvae at 5 dpf. rab28 KO larvae do not show any reduction in visual acuity compared with sibling control when tested at 0.02, 0.06 or 0.2 cpd, analyzed using a student's t test. Data are from three independent replicates, analyzed using a student's t test. (I) Normalized ERG b-wave amplitudes recorded in rab28 KO at 2 months post fertilization show no significant difference compared with ERG-traces from wild-type controls (n = 12, n = 13), statistical analysis was carried out using a student's t test
PHENOTYPE:
|
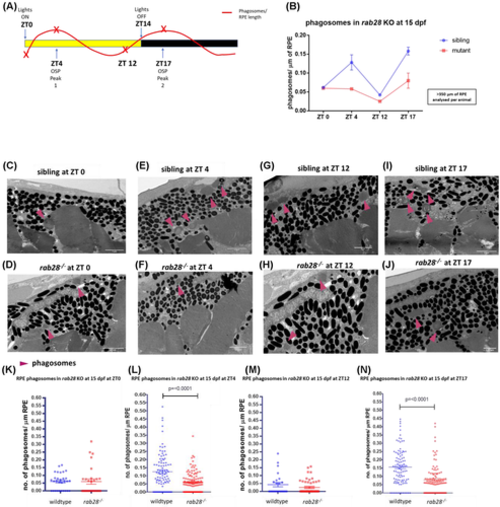
rab28 knockout zebrafish have reduced levels of retinal pigment epithelium (RPE) phagosomes, at 2 known outer segment phagocytosis peaks. (A) Time course highlighting sample collection time (red x) in relation to phagosome level fluctuation. (B) Trend line demonstrating the level of RPE phagosomes present in rab28 KO (red) compared with sibling controls (blue) at defined time points throughout the day. (C–J) Representative TEM images of rab28 sibling controls and KO retinae at 15 days post fertilization, with phagosomes indicated (pink arrows). Scale bar; 2 μm, (K–N) Scatter plots of phagosome/μm of RPE in rab28 sibling and KO retinas at distinct time points. rab28 KO fish have ~55% reduction in OS engulfed RPE phagosomes in comparison with sibling controls at ZT 4 and ZT 17. Statistical analysis carried out using an unpaired student's t test for each distinct time point. RPE of >350 μm was analyzed per animal. N = 6 retinae per genotype at ZT 4 and ZT 17, N = 2 retinae per genotype at ZT 0 and ZT 12
PHENOTYPE:
|

rab28 knockout zebrafish have reduced levels of retinal pigment epithelium (RPE) phagosomes containing OS, which can be rescued using cone-specific expression of eGFP; Rab28 (A) Time course highlighting sample collection time (red x) in relation to RPE phagosome numbers. (B) Scatter plots of phagosome/μm of RPE in rab28 sibling, KO, and eGFP-Rab28 variants in the KO background. rab28 KO fish have ~55% reduction in RPE phagosomes containing engulfed OS material in comparison with sibling controls. rab28 KO expressing Tg(eGFP:Rab28WT,QL,TN) rescue this phenotype and do not show reduced numbers of RPE phagosomes containing engulfed OS shed material. Statistical analysis was performed using a one-way anova, followed by a Bonferroni multiple comparison test. Error bars show SEM. N = 3 animals per genotype. (C–G) Representative TEM images of rab28 sibling control, KO and KO expressing Tg(eGFP:Rab28WT,TN, QL) retinae at 15 days post fertilization, with phagosomes indicated (pink arrows). Scale bar; 2 μm. RPE of >350 μm was analyzed per animal.
PHENOTYPE:
|

Zebrafish outer segment phagocytosis (OSP) is regulated by external light sources. (A,E) Time course highlighting sample collection time (red x), and light-dark cycle. Samples were collected at ZT 4, ZT 9, and ZT 17 from 16 days post fertilization (dpf) wild-type zebrafish retinae. At each time point, one cohort had undergone a regular 14:10 light:dark cycle. The other had been raised in dark from ZT 10 the day prior to collection and were euthanized under red light. (B–D, G,H) Representative TEM images of wild-type retinae at 16 dpf, with phagosomes indicated (pink arrows). Scale bar; 5 μm. (I) Scatter plots of phagosome/μm of retinal pigment epithelium (RPE) in dark-reared and control retinas at ZT 4 and ZT 17 (OSP peaks) and ZT 9 (OSP trough). Fish raised in the dark for have ~35%–55% reductions in the number of RPE phagosomes containing engulfed OS material in comparison with controls at ZT 4 and ZT 17 respectively. Statistical analysis carried out by student's t test between individual groups. RPE of >570 μm was measured per animal. N = 3 animals (6 retinae) per group per time point. (J) Trend line demonstrating the level of RPE phagosomes present in the dark-raised wild-type eyes (black) compared with controls exposed to the regular light-dark cycle (orange) at defined time points throughout the day. A two-way anova, followed by Turkey's multiple comparison testing revealed no significant difference between CT 4 CT 9 or CT 17 (black), but a significant difference between ZT 4 versus ZT 9 (p = .0229), ZT 9 versus ZT 17 (p ≤ .0001), and ZT 4 versus ZT 17 (p = .003) (orange)
|

Investigation into internal regulators of zebrafish outer segment phagocytosis (OSP). (A) Time course highlighting sample collection time (red x) in relation to phagosome-level fluctuation (B) Heat map representing differentially expressed proteins between 2 months post fertilization wild-type siblings at ZT 4, ZT 9, and ZT 17, respectively, illustrating proteins significantly upregulated (in red) or downregulated (in green), given a cut-off of −log p-value ≥1.3. Student's t test was used for statistical analysis. (C) Gene ontology analysis of significantly downregulated and upregulated proteins at OSP peaks (ZT 4 and ZT 17 grouped) compared with an OSP trough (ZT 9). (D–F) Box and whisker plots showing the normalized expression profile of known OSP-associated proteins Itgav, Lamp1b, and Abcf1 at ZT 4, ZT 9, and ZT 17. (G) Table containing the number of proteins that are specifically upregulated or downregulated at ZT 4, ZT 17, or ZT 9. (H) Table documenting the mean of the seven proteins specifically downregulated at the OSP trough (ZT 9) compared with OSP peaks (ZT 4 and ZT-17); the difference in the mean and the upper and lower confidence intervals for ZT 4 relative to ZT 9 or ZT 9 relative to ZT 17.
|
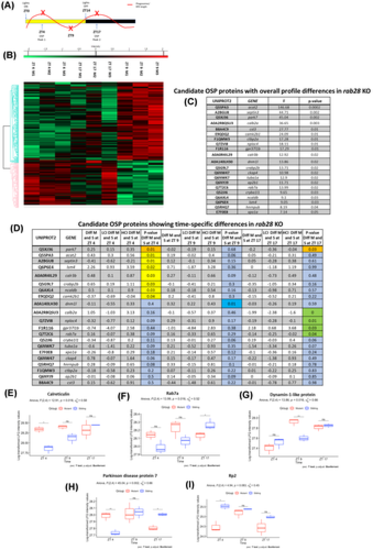
Investigation into outer segment phagocytosis (OSP) regulators in rab28 KO retinae (A) Time course highlighting sample collection time (red x) in relation to phagosome level fluctuation (B) Heat map representing differentially expressed proteins at ZT 4, ZT 9, or ZT 17 in 2 months post fertilization rab28 KO illustrating proteins significantly upregulated (in red) or downregulated (in green), given a –log p-value cut-off of ≥1.3. Student's t test was used for statistical analysis. (C) Table of 21 proteins derived from the 52 candidate OSP regulators (Figure 6) that have a statistically significant interaction, indicating that for these proteins, the relationships between group (rab28 KO vs. sibling) and log-transformed LFQ intensity depends on Zeitgeiber time (ZT 4, ZT 9, and ZT 17) as determined by a two-way anova. (D) Table of 21 candidate OSP regulators disrupted in rab28 KO documenting in more detail the specific time points altered. The difference in the log-transformed LFQ intensity between the rab28 KO and sibling group, their corresponding lower and upper confidence intervals (LCI and HCI) and the p-value indicating if this difference is significant at each time point respectively is shown. Colored boxes indicate when the p-value for the pairwise t test determines that there is a statistically significant difference between log-transformed LFQ intensity for rab28 KO versus sibling; orange- ZT 4 and ZT 17, yellow- ZT 4, blue ZT 9, green-ZT 17. (E–I) Box and whisker plots showing the log-transformed LFQ intensity of the known OSP-associated proteins Calreticulin, Rab7a, Dynamin-1-like protein, Parkinson disease protein 7 and Rp2 at ZT 4, ZT 9 and ZT 17, highlighting significant differences between wild-type siblings (sibling) and rab28 KO (mutant) at specific time points
EXPRESSION / LABELING:
PHENOTYPE:
|

rab28 KO zebrafish eyes show a reduced level of total retinoids and retinyl esters at 15 days post fertilization (dpf) with an additional reduction in levels of the visual chromophore 11-cis-retinal at 8 months post fertilization (mpf). (A) Retinoid profiles of 15 dpf rab28 KO zebrafish eyes and sibling controls were analyzed using normal phase high-performance liquid chromatography (HPLC). Bars represent the mean ± SD of three independent experiments for each genotype with 100 heads per biological replicate. rab28 KO mutant eyes showed significantly reduced levels of 11-cis-retinyl palmitate (p = .0127), all-trans-retinyl palmitate (p = .0306) compared with sibling controls (B) Retinoid profiles of 8 mpf rab28 KO zebrafish eyes and sibling controls were analyzed using HPLC. Bars represent the mean ± SD of three independent experiments for each genotype with four eyes per biological replicate. rab28 KO eyes show significantly reduced levels of 11-cis-retinal (p = .0110), all-trans-retinyl palmitate (p = .0313) compared with sibling controls. rab28 KO eyes also show a significantly reduced level of total retinoid (p = .0178). (C) Bisretinoid profiling by HPLC reveal a significant increase (p = .0059) in the levels of A2PE in the rab28 KO compared with wild-type sibling controls at 1 year old. Bars represent the mean ± SD of A2PE expressed as milli absorbance units (mAU); six eyes per biological replicate (n = 4) were analyzed for each genotype. Data were analyzed by unpaired, two-tailed t tests
PHENOTYPE:
|