
Image
|
Figure Caption
Fig. 1
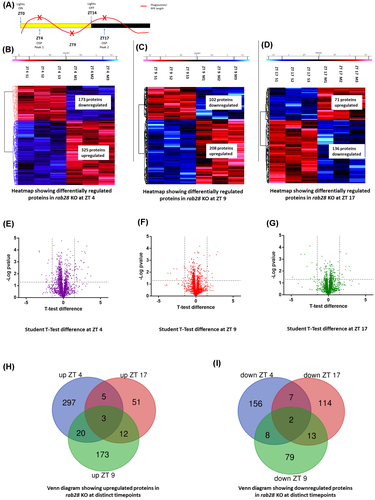
rab28 knockout zebrafish have altered proteome profiles (A) Time course highlighting sample collection time (red x) in relation to phagosome level fluctuation. (B–D) Heat maps representing the differentially expressed proteins between 2 months post fertilization wild-type siblings and rab28−/− at ZT 4, ZT 9 and ZT 17 respectively, illustrating proteins significantly upregulated (in red) or downregulated (in blue), given a cut-off of −log p-value ≥1.3. Student's t test was used for statistical analysis (N = 3). (E–G) Volcano plot representing differentially expressed proteins between wild-type siblings and rab28−/− given a fold change cut-off of ±1.2 and −log p-value ≥1.3. Student's t test was used for statistical analysis. (H,I) Venn diagram representing common and mutually exclusive proteins upregulated (H) and downregulated (I) between rab28 KO and wild-type siblings at ZT 4, ZT 9, and ZT 17
Acknowledgments
This image is the copyrighted work of the attributed author or publisher, and
ZFIN has permission only to display this image to its users.
Additional permissions should be obtained from the applicable author or publisher of the image.
Full text @ FASEB J.