
- Title
-
Sema6D Regulates Zebrafish Vascular Patterning and Motor Neuronal Axon Growth in Spinal Cord
- Authors
- Sheng, J., Xu, J., Geng, K., Liu, D.
- Source
- Full text @ Front. Mol. Neurosci.
|
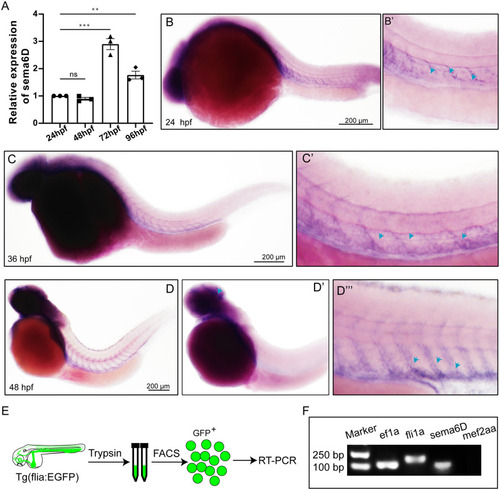
Figure 2. Expression of sema6D gene in embryonic zebrafish at different stages. (A) QRT-PCR analysis of sema6D expression in embryonic zebrafish at different stages (n = 3). One-way ANOVA, values with ** and *** above the bars are significantly different (P < 0.01 and P < 0.001, respectively); value with “ns” above the bars indicated no significantly different. (B–D) Whole mount in situ hybridization analysis of sema6D in zebrafish embryos at different stages, blue arrowheads indicate blood vessels. (E) The procedure of the endothelial cells sorting and RT-PCR. (F) The agarose gel electrophoresis results of RT-PCR on fli1a-EGFP sorted cells. |
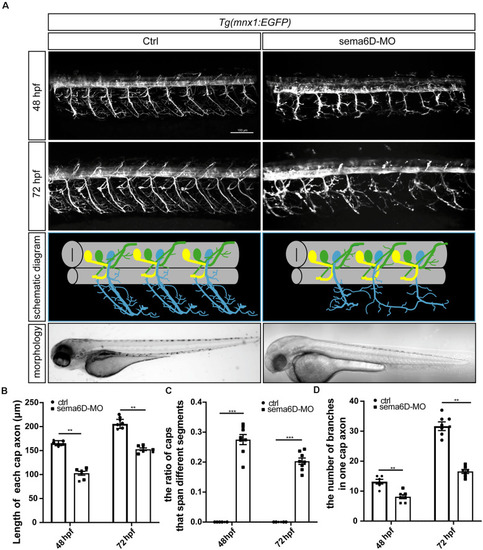
Primary motor neuron morphogenesis defects in the PHENOTYPE:
|
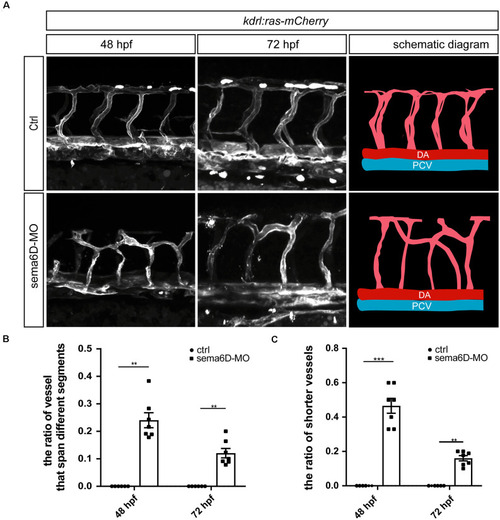
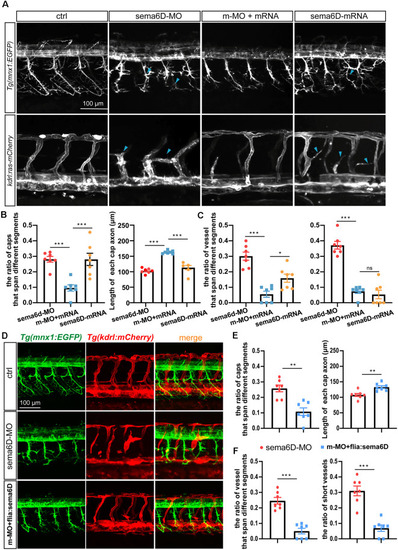
Figure 4. Deficiency of sema6D caused aberrant vascular networks. (A) Confocal imaging analysis of ISVs in the control and sema6D-MO embryos at 48 and 72 hpf. (B) The statistical analysis of the ratio of vessels that span different segments in the control and sema6D morphants at 48 and 72 hpf (n = 7). About 9–12 ISVs were used for statistics per zebrafish. Mann-Whitney test, P = 0.0012.Values with ** above the bars are significantly different (P < 0.01).(C) The statistical analysis of the ratio of shorter vessels in the control and sema6D morphants at 48 and 72 hpf (n = 7). About 9–12 ISVs were used for statistics per zebrafish. Mann-Whitney test, 48 hpf: P = 0.0006; 72 hpf: P = 0.0012. Values with ** and *** above the bars are significantly different (P < 0.01 and P < 0.001, respectively). PHENOTYPE:
|
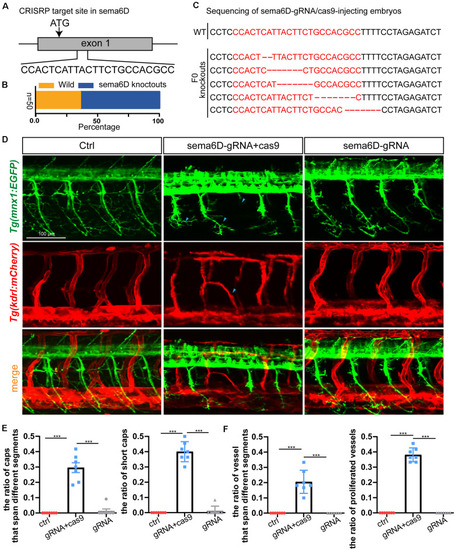
Knockout of PHENOTYPE:
|
Overexpressing |