IMAGE

Figure 3

ID
ZDB-IMAGE-220427-8
Source
Figures for Sheng et al., 2022
Image
Figure Caption

Figure 3

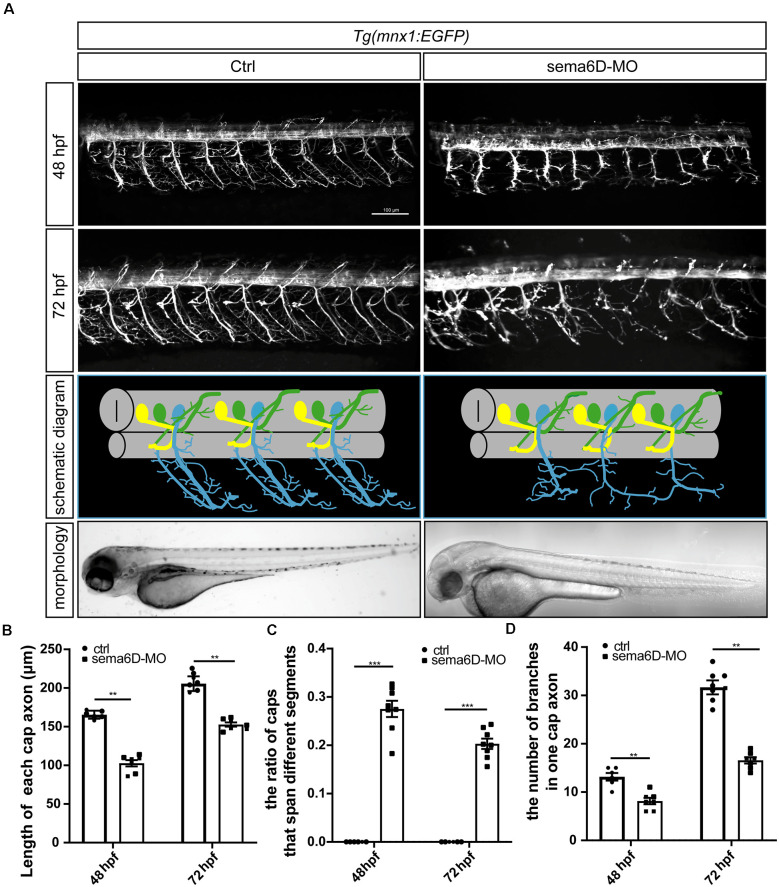
Primary motor neuron morphogenesis defects in the sema6D knockout zebrafish. (A) Confocal imaging analysis of PMNs in control and sema6D knockout groups at 48 and 72 hpf. (B) The statistical analysis of the length of each cap axon in the control and sema6D morphants at 48 and 72 hpf (n = 7). The length of five cap axon was measured in each zebrafish and the average was used. Mann-Whitney test, P = 0.0012. Values with ** above the bars are significantly different (P < 0.01). (C) The statistical analysis of the ratio of Caps across different segments in the control and sema6D morphants at 48 and 72 hpf (n = 8). Mann-Whitney test, P = 0.0007. Values with *** above the bars are significantly different (P < 0.001). (D) The statistical analysis of the number of branches in one cap axon in the control and sema6D morphants at 48 and 72 hpf. The number of branches in each cap axon was measured in five axon of each zebrafish and the average was used. Mann-Whitney test, 48 hpf: P = 0.0017; 72 hpf: P = 0.0012. Values with ** above the bars are significantly different (P < 0.01).

Figure Data
Acknowledgments
This image is the copyrighted work of the attributed author or publisher, and ZFIN has permission only to display this image to its users. Additional permissions should be obtained from the applicable author or publisher of the image. Full text @ Front. Mol. Neurosci.