
|
Figure 2
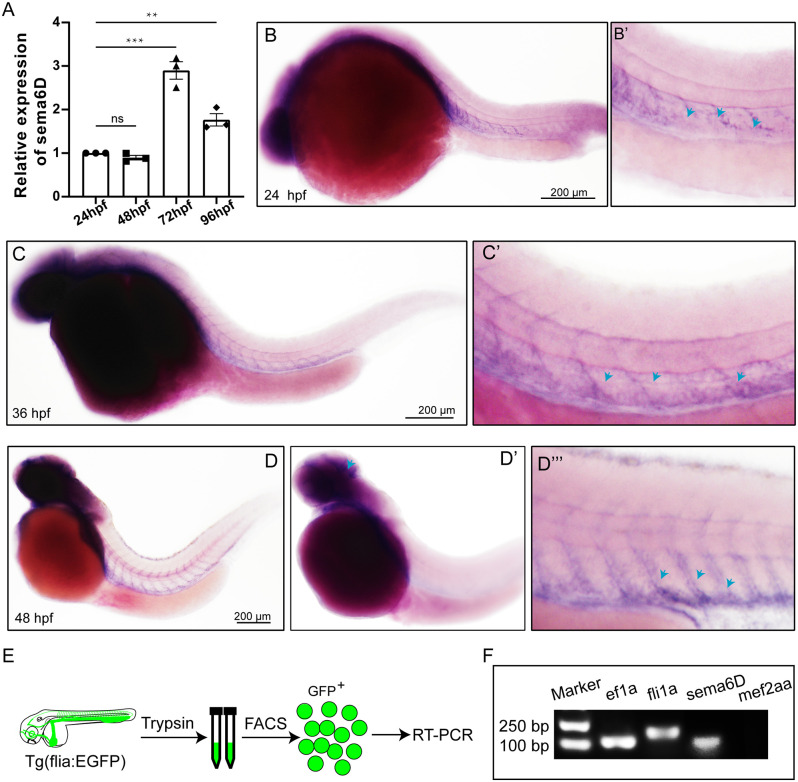
Figure 2. Expression of sema6D gene in embryonic zebrafish at different stages. (A) QRT-PCR analysis of sema6D expression in embryonic zebrafish at different stages (n = 3). One-way ANOVA, values with ** and *** above the bars are significantly different (P < 0.01 and P < 0.001, respectively); value with “ns” above the bars indicated no significantly different. (B–D) Whole mount in situ hybridization analysis of sema6D in zebrafish embryos at different stages, blue arrowheads indicate blood vessels. (E) The procedure of the endothelial cells sorting and RT-PCR. (F) The agarose gel electrophoresis results of RT-PCR on fli1a-EGFP sorted cells.