
- Title
-
Assessment of the Preventive Effect of L-carnitine on Post-statin Muscle Damage in a Zebrafish Model
- Authors
- Niedbalska-Tarnowska, J., Ochenkowska, K., Migocka-Patrzałek, M., Dubińska-Magiera, M.
- Source
- Full text @ Cells
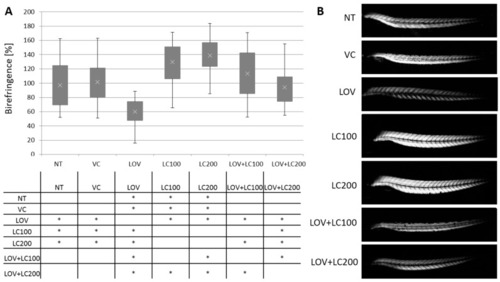
Figure 1. Analysis of skeletal muscle structure of 120 hpf zebrafish larvae exposed to lovastatin (LOV) and L-carnitine (LC) treatment. Control (non-treated, NT; vehicle control, VC; 100 μM L-carnitine, LC100; 200 μM L-carnitine, LC200) were compared with experimental groups (0.5 μM lovastatin, LOV; 0.5 μM lovastatin and 100 μM L-carnitine, LOV+LC100; 0.5 μM lovastatin and 200 μM L-carnitine LOV+LC200). (A) The birefringence of zebrafish larvae trunk skeletal muscles, obtained in polarised light, reflects the qualitative changes in muscle structure (magnification 100x, Leica DM5000 light microscope). (B) The quantitative analysis revealed that the differences between groups were statistically significant. The table below indicates the pairwise comparison between investigated groups. Statistically significant differences are indicated with *; * p < 0.05 (ANOVA test followed by the Games–Howell post-hoc test), the experiment was repeated at least three times (with 40 to 86 individuals in each investigated group). Error bars show the standard deviation.
|
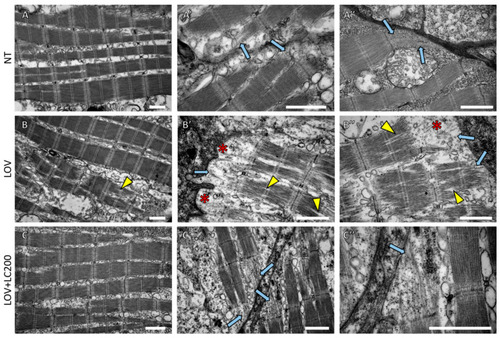
Figure 2. Ultrastructural analysis of skeletal muscles of 120 hpf zebrafish larvae exposed to lovastatin (LOV) and L-carnitine (LOV+LC200) treatment. TEM micrographs show (A,A’,A’’) NT (non-treated larvae); (B,B’,B’’) LOV (0.5 μM lovastatin); (C,C’,C’’) larvae incubated in a mixture of LOV+LC200 (0.5 μM lovastatin and 200 μM L-carnitine). Light blue arrows indicate sarcomeric filaments within subsarcolemmal regions; yellow arrowheads indicate delamination of filaments within sarcomeres; note the disruption of sarcomeric filaments in skeletal muscles of lovastatin-treated larvae (red asterisks); scale bar = 1 µm.
|

Figure 3. Real-time quantitative PCR (RT qPCR) of atrogin-1 mRNA expression level in the whole body of 120 hpf zebrafish larvae exposed to lovastatin (LOV) and L-carnitine (LC) treatment. Bar graph demonstrates atrogin-1 mRNA expression level of zebrafish larvae in control (non-treated, NT; vehicle control, VC; 100 μM L-carnitine, LC100; 200 μM L-carnitine, LC200) and experimental (0.5 μM lovastatin, LOV; 0.5 μM lovastatin and 100 μM L-carnitine, LOV+LC100; 0.5 μM lovastatin and 200 μM L-carnitine LOV+LC200) groups. Expression of atrogin-1 mRNA was normalised to rpl13a (ribosomal protein L13a). A.U., arbitrary unit. Error bars show the standard deviation. The tables below indicate the pairwise comparison between atrogin-1 expression levels in investigated groups. Statistically significant differences are indicated with *; * p < 0.05 (Student’s t-test). The experiment was performed 3 times (with 25–30 individuals in each investigated group).
|

Figure 4. Swimming behaviour of 120 hpf zebrafish larvae exposed to lovastatin (LOV) and L-carnitine (LOV+LC200) treatment. (A) Spontaneous displacement of zebrafish larvae in control (non-treated, NT; vehicle control, VC; 100 μM L-carnitine, LC100; 200 μM L-carnitine, LC200) and experimental (0.5 μM lovastatin, LOV; 0.5 μM lovastatin and 100 μM L-carnitine, LOV+LC100; 0.5 μM lovastatin and 200 μM L-carnitine LOV+LC200) groups. Graphs show larvae displacement over the 10 min period. (B) Bar graph demonstrates the percentage of zebrafish larvae in seven investigated groups in 4 ranges of the distance travelled: no movement (up to 0.5), from 0.5 to 1.5, from 1.5 to 3, and more than 3 cm. The table below indicates the pairwise comparison between responses of seven investigated groups. Statistically significant differences are indicated with *; * p < 0.05 (Kruskal–Wallis test followed by the Pairwise Mann–Whitney post-hoc test). The experiment was repeated at least 3 times (with 18 to 20 individuals in each investigated group). (C) Touch-evoked response assay. Stacked column graphs demonstrate the number of zebrafish larvae as a function of their response to first (F) and second (S) tail touch stimulation, as well as in response to a head touch. Depending on the type of reaction, zebrafish larvae were divided into 4 groups: no response, response without escaping (defined as a lateral undulation of the tail immediately after being touched), short distance (larvae travelled a distance of no more than 20 mm), long distance (larvae travelled more than 20 mm). The tables below indicate the pairwise comparison between responses of seven investigated groups. Statistically significant differences are indicated with *; * p < 0.05 (Kruskal–Wallis test followed by the pairwise Mann–Whitney post-hoc test). The experiment was repeated at least 3 times (with 18 to 20 individuals in each investigated group).
|

Figure 5. Heartbeat analysis of 120 hpf zebrafish larvae exposed to lovastatin (LOV) and L-carnitine (LC) treatment. (A) Bar graph demonstrates heartbeats of zebrafish larvae in control (non-treated, NT; vehicle control, VC; 100 μM L-carnitine, LC100; 200 μM L-carnitine, LC200) and experimental (0.5 μM lovastatin, LOV; 0.5 μM lovastatin and 100 μM L-carnitine, LOV+LC100; 0.5 μM lovastatin and 200 μM L-carnitine LOV+LC200) groups. The table below indicates the pairwise comparison between heartbeat rates of seven investigated groups. Statistically significant differences are indicated with *; * p < 0.05 (ANOVA test followed by the Games–Howell post-hoc test). bpm, beats per minute. The experiment was repeated at least 3 times (with 8 to 31 individuals in each investigated group). Error bars show the standard deviation. (B,B’) exemplary kymographs of investigated groups; red line, dynamic pixel change pattern; blue line, smoothed plot profile. Kymographs were generated via Time Series Analyser 3 (TSA, Image J plugin).
|

Figure 6. Analysis of heart contraction in 120 hpf zebrafish larvae exposed to lovastatin (LOV) and L-carnitine (LC) treatment. Atrial contraction expressed as the percentage difference between the atrial surface in systolic and relaxed states. Ventricular contraction expressed as the percentage difference between the ventricular surface in systolic and relaxed states. Bar graphs illustrate measurements of the atrial (A) and ventricular (B) contraction of zebrafish larva heart in control (non-treated, NT; vehicle control, VC; 100 μM L-carnitine, LC100; 200 μM L-carnitine, LC200) and experimental (0.5 μM lovastatin, LOV; 0.5 μM lovastatin and 100 μM L-carnitine, LOV+LC100; 0.5 μM lovastatin and 200 μM L-carnitine LOV+LC200) groups. The tables below indicate the pairwise comparison between atrial (A) and ventricular (B) contraction of seven investigated groups. Statistically significant differences are indicated with *; * p < 0.05 Kruskal–Wallis test followed by pairwise Mann–Whitney post-hoc tests); 5 individuals in each investigated group. Error bars show the standard deviation. (C) Exemplary graphs show the systolic and diastolic heart outlines of seven investigated groups used for calculations. Orange line represents ventricle relaxation (ventricular diastole); red dashed line, ventricle contraction (ventricular systole); grey line, atrium relaxation (atrial diastole); black dashed line, atrium contraction (atrial systole).
|