
Image
|
Figure Caption
Figure 6
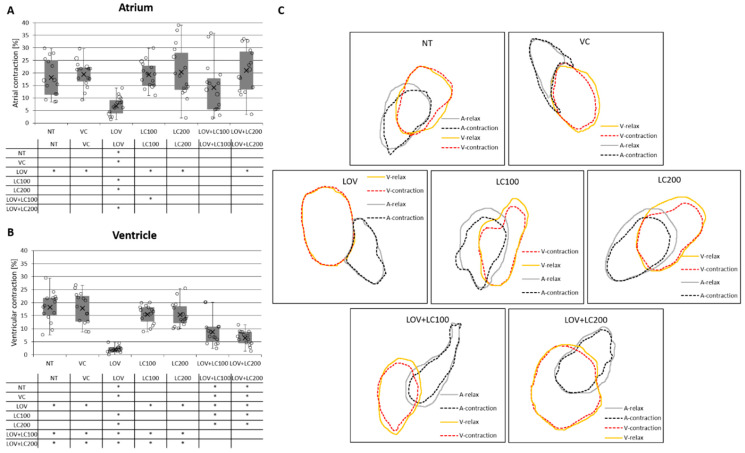
Figure 6. Analysis of heart contraction in 120 hpf zebrafish larvae exposed to lovastatin (LOV) and L-carnitine (LC) treatment. Atrial contraction expressed as the percentage difference between the atrial surface in systolic and relaxed states. Ventricular contraction expressed as the percentage difference between the ventricular surface in systolic and relaxed states. Bar graphs illustrate measurements of the atrial (A) and ventricular (B) contraction of zebrafish larva heart in control (non-treated, NT; vehicle control, VC; 100 μM L-carnitine, LC100; 200 μM L-carnitine, LC200) and experimental (0.5 μM lovastatin, LOV; 0.5 μM lovastatin and 100 μM L-carnitine, LOV+LC100; 0.5 μM lovastatin and 200 μM L-carnitine LOV+LC200) groups. The tables below indicate the pairwise comparison between atrial (A) and ventricular (B) contraction of seven investigated groups. Statistically significant differences are indicated with *; * p < 0.05 Kruskal–Wallis test followed by pairwise Mann–Whitney post-hoc tests); 5 individuals in each investigated group. Error bars show the standard deviation. (C) Exemplary graphs show the systolic and diastolic heart outlines of seven investigated groups used for calculations. Orange line represents ventricle relaxation (ventricular diastole); red dashed line, ventricle contraction (ventricular systole); grey line, atrium relaxation (atrial diastole); black dashed line, atrium contraction (atrial systole).
Acknowledgments
This image is the copyrighted work of the attributed author or publisher, and
ZFIN has permission only to display this image to its users.
Additional permissions should be obtained from the applicable author or publisher of the image.
Full text @ Cells