
Image
|
Figure Caption
Figure 1
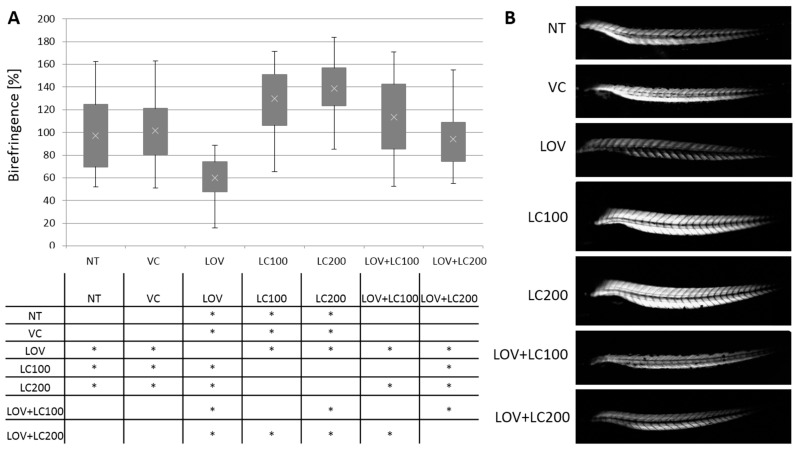
Figure 1. Analysis of skeletal muscle structure of 120 hpf zebrafish larvae exposed to lovastatin (LOV) and L-carnitine (LC) treatment. Control (non-treated, NT; vehicle control, VC; 100 μM L-carnitine, LC100; 200 μM L-carnitine, LC200) were compared with experimental groups (0.5 μM lovastatin, LOV; 0.5 μM lovastatin and 100 μM L-carnitine, LOV+LC100; 0.5 μM lovastatin and 200 μM L-carnitine LOV+LC200). (A) The birefringence of zebrafish larvae trunk skeletal muscles, obtained in polarised light, reflects the qualitative changes in muscle structure (magnification 100x, Leica DM5000 light microscope). (B) The quantitative analysis revealed that the differences between groups were statistically significant. The table below indicates the pairwise comparison between investigated groups. Statistically significant differences are indicated with *; * p < 0.05 (ANOVA test followed by the Games–Howell post-hoc test), the experiment was repeated at least three times (with 40 to 86 individuals in each investigated group). Error bars show the standard deviation.
Acknowledgments
This image is the copyrighted work of the attributed author or publisher, and
ZFIN has permission only to display this image to its users.
Additional permissions should be obtained from the applicable author or publisher of the image.
Full text @ Cells