
Image
|
Figure Caption
Figure 3
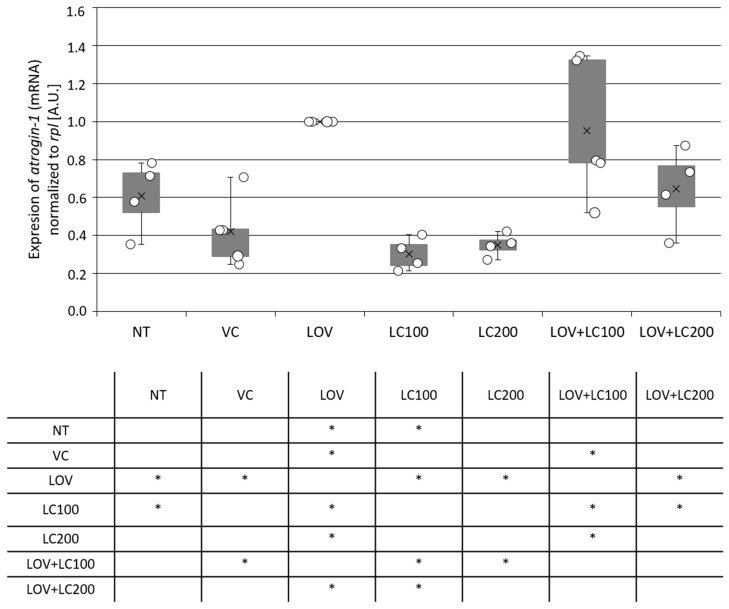
Figure 3. Real-time quantitative PCR (RT qPCR) of atrogin-1 mRNA expression level in the whole body of 120 hpf zebrafish larvae exposed to lovastatin (LOV) and L-carnitine (LC) treatment. Bar graph demonstrates atrogin-1 mRNA expression level of zebrafish larvae in control (non-treated, NT; vehicle control, VC; 100 μM L-carnitine, LC100; 200 μM L-carnitine, LC200) and experimental (0.5 μM lovastatin, LOV; 0.5 μM lovastatin and 100 μM L-carnitine, LOV+LC100; 0.5 μM lovastatin and 200 μM L-carnitine LOV+LC200) groups. Expression of atrogin-1 mRNA was normalised to rpl13a (ribosomal protein L13a). A.U., arbitrary unit. Error bars show the standard deviation. The tables below indicate the pairwise comparison between atrogin-1 expression levels in investigated groups. Statistically significant differences are indicated with *; * p < 0.05 (Student’s t-test). The experiment was performed 3 times (with 25–30 individuals in each investigated group).
Acknowledgments
This image is the copyrighted work of the attributed author or publisher, and
ZFIN has permission only to display this image to its users.
Additional permissions should be obtained from the applicable author or publisher of the image.
Full text @ Cells