FIGURE SUMMARY
Title

Vascular Injury in the Zebrafish Tail Modulates Blood Flow and Peak Wall Shear Stress to Restore Embryonic Circular Network

Authors
Baek, K.I., Chang, S.S., Chang, C.C., Roustaei, M., Ding, Y., Wang, Y., Chen, J., O'Donnell, R., Chen, H., Ashby, J.W., Xu, X., Mack, J.J., Cavallero, S., Roper, M., Hsiai, T.K.
Source
Full text @ Front Cardiovasc Med

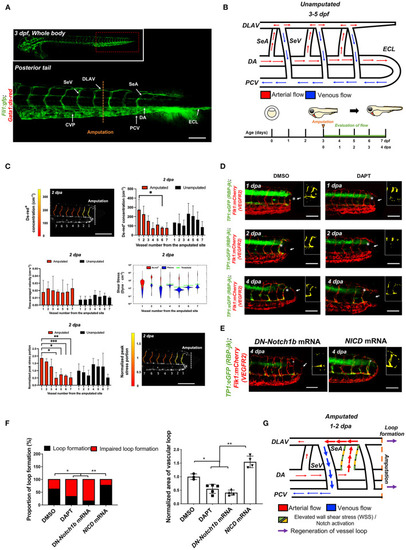
Tail amputation increases peak wall shear stress (WSS) in the segmental artery (SeA) closest to the amputation site to promote Notch-mediated dorsal longitudinal anastomotic vessel-posterior cardinal vein (DLAV-PCV) loop formation. (A) Anatomy of tail vasculature in Tg(fli1:gfp; gata1:ds-red) embryos; Scale bar: 100 μm. (B) Wiring diagram illustrate embryonic circulation in zebrafish tail. In the caudal vascular network, dorsal aorta (DA) forms an embryonic circulatory loop (ECL) with PCV (white arrow), and venous flow in the DLAV and venous segmental vessel (SeV) drain into PCV (white arrowheads). Experimental design: At 3 days post fertilization (dpf), embryos were randomly chosen for tail amputation (~100 μm of posterior tail segment). Hemodynamic WSS was evaluated for 4 consecutive days. (C) At 2 dpa, ds-red+ concentration (cm−1, number of ds-red+ per unit length of SeA) in the amputated site increased significantly compared to unamputated embryos (Mean ± standard deviation across the vessels in 3 unamputated embryos, averaged over 3.6 mins). Time-averaged velocity (cm·s−1) remained unchanged. The distribution of WSS exerted by ds-red+ (red) is shifted upward compared to that exerted by plasma (blue), giving intermittent rises of WSS as each ds-red+ passes. Although this separation is present in every SeA, the portion of ECs (red area) experiencing WSS from ds-red+ is higher in the proximal SeAs than in the distal SeAs, leading to a higher peak stress portion. The areas scale with but are not equal to the portion of endothelial cells (ECs) that experience stress from ds-red+ and plasma. Green line shows the 0.975 percentile of WSS from plasma, which is used as an activation threshold. For the calculation of WSS, see Methods. The increase in viscosity resulted WSS to exceed activation threshold in the site of amputation. The threshold is set to 0.975 percentile of plasma shear stress across all intersegmental vessels, and ranges from 1.1 to 5.4 dyne·cm−2. (D) In the transgenic Tg(tp1:gfp; flk1: mcherry) line, vehicle Dimethyl sulfoxide (DMSO)-treated zebrafish showed prominent endothelial tp1 activity in the proximal SeA (*asterisk, overlapped yellow) and formed a new vascular loop between the DLAV and PCV at 4 dpa (white arrow). Pharmacological γ-secretase inhibitor (DAPT) treatment (100 μM) attenuated endothelial tp1 activity in the amputated site and neighboring SeA and impaired regeneration of the loop by 4 dpa (white arrow). Scale bar: 20 μm. (E) Transient suppression of Notch activity via DN-Notch1b mRNA, but not Notch Intracellular Cytoplasmic Domain (NICD) mRNA, impaired vascular loop formation. Scale bar: 20 μm. (F) Quantification of the proportion of embryos exhibiting loop formation and normalized area of vascular loop (*p< 0.05 vs. DMSO, **p< 0.005 vs. NICD mRNA, n = 17 for DMSO, n = 20 for DAPT, DN-Notch1b and NICD mRNAs to assess proportion of loop formation, n = 3 for DMSO, n = 5 for DAPT, DN-Notch1b and NICD mRNAs to assess area of vascular loop). (G) Wiring diagrams illustrate amputation-mediated changes in blood flow and hemodynamic WSS. SeA, Arterial segmental vessel; SeV, Venous segmental vessel; DLAV, Dorsal longitudinal anastomotic vessel; PCV, Posterior cardinal vein; DA, Dorsal aorta; CVP, Caudal vein capillary plexus; ECL, Embryonic circulatory loop. ***p < 0.0005.

Changes in WSS modulate DLAV-PCV loop formation in a Notch-dependent manner. (A) Experimental design to genetically and pharmacologically manipulate hemodynamic WSS in zebrafish embryos. (B) In response to tail amputation, Gata1a morpholino oligonucleotides (MO) injection (1 mM) or 2,3-butanedione monoxime (BDM, 100 μM) treatment impaired vascular loop formation at 4 dpa (white arrows). Erythropoietin (epo) mRNA injection (10–20 pg/nl), isoproterenol treatment (100 μM) and 6% hydroxyethyl hetastarch promoted regeneration and vascular loop formation. Scale bar: 20 μm. (C)Gata1a MO and BDM treatment reduced endothelial tp1 activity and impaired regeneration, whereas epo mRNA injection or isoproterenol treatment up-regulated endothelial tp1 activity in the amputated site (white arrowheads) and promoted vascular loop formation at 4 dpa (white arrows). Scale bar: 20 μm. (D,E) Quantification of the proportion of embryos exhibiting loop formation and normalized area of vascular loop (*p< 0.05, **p< 0.005 vs. control MO, n = 20 for each group to assess proportion, n = 5 for each group to assess area of vascular loop). Scale bar: 20 μm.

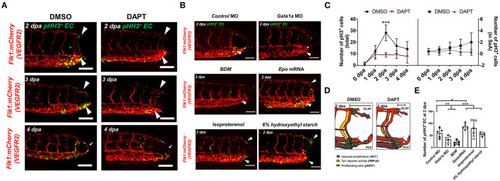
Figure 3. Amputation-mediated Notch signaling regulates EC proliferation in the DLAV and CVP during vascular loop formation. (A) DAPT treatment to inhibit Notch activity significantly reduced the number of EC proliferation (pHH3+EC, green) compared to DMSO-treated controls at 2 dpa (white arrowheads). Scale bar: 20 μm. (B) Gata1a MO injection or BDM treatment reduced, whereas epo mRNA and isoproterenol treatment increased pHH3+ EC at 2 dpa. (*p< 0.05, **p< 0.005, ***p< 0.0005 vs. control MO, n = 5 for each group). Scale bar: 20 μm. (C) Total numbers of endothelial pHH3+ EC in posterior tail segment and the caudal SeA were assessed to quantify Notch-dependent proliferation. 2 days of DAPT treatment resulted ~48% reduction in total number of pHH3+ EC, but not in the caudal SeA (**p< 0.005 vs. DMSO, n = 3 for DMSO, n = 5 per other groups). (D) Schematic representation of Notch-mediated pHH3+ EC during vascular loop formation. (E) Total pHH3+ EC in posterior tail were assessed to quantify WSS-dependent EC proliferation. Gata1a MO injection or BDM treatment reduced ~42 and ~65%, whereas epo mRNA and isoproterenol treatment increased pHH3+ EC by ~52 and ~39% respectively at 2 dpa. (*p< 0.05, **p< 0.005, ***p< 0.0005 vs. control MO, n = 5 for each group). Scale bar: 20 μm.

WSS promotes Notch-mediated arterial network. (A) A representative image of tail vasculature in the transgenic Tg(flt1:tdtomatoe; flt4: yfp) zebrafish line at 3 dpf. flt1+: arterial vascular endothelium, flt4+: venous vascular endothelium. flt1+ & flt4+ DLAV: flt1+ or flt4+ regenerated from the DLAV. flt4+ PCV: flt4+ regenerated from the PCV. Scale bar: 100 μm. (B) In response to DMSO treatment, flt1+ arteries preferentially formed an initial dorsal to ventral connection between the DLAV (flt1+ DLAV) and the DA in the amputated site (white arrowhead). Between 1–2 dpa, flt4+ veins from the DLAV (flt4+ DLAV) regenerated toward the DA exhibiting collateral arterial phenotype (overlapped yellow, white arrowheads). While regeneration of flt4+ veins occurred in the PCV (flt4+ PCV) and DLAV (flt4+ DLAV) for loop formation between 2–3 dpa, the distal segmental network exhibited enhanced flt1 expression at 3 dpa. flt1+ arteries extended dorsally from SeA at 4 dpa and formed a vascular loop with flt4+ PCV (white arrow). Conversely, DAPT treatment inhibited the initial connections of both flt1+ arteries and flt4+ veins at 2 dpa and partially inhibited both flt4+ DLAV and CVP at 3 dpa (white arrowheads). At 4 dpa, DAPT treatment inhibited flt1+network (white arrowheads) and attenuated loop formation at 4 dpa (white arrows, n = 5 per group). Scale bar: 20 μm. (C) Following tail amputation, Gata1a MO injection or BDM treatment diminished flt1+ in the amputated site (white arrowheads) and partially attenuated flt4+ DLAV and PCV (*asterisk, n = 20 per group). Increase in WSS (epo mRNA, isoproterenol, 6% hydroxyethyl hetastarch) enhanced flt1+ network (white arrowheads) during loop formation (white arrows) as compared to MO-injected controls. (n = 20 per group). Scale bar: 20 μm. (D) Schematic representations and 3-dimensional (3D) overview of WSS-mediated arterial- and venous- regeneration. Black arrowheads depict regenerated flt1+ (Red) and flt4+ network (Blue) in response to changes in WSS.

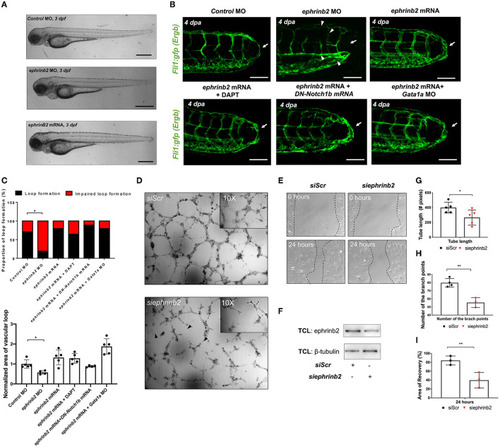
Ephrinb2 regulates vascular loop formation. (A) Gross morphology following global ephrinb2 modulation. Both ephrinb2 MO and mRNA injections did not affect gross zebrafish morphology (white arrowheads). Scale bar: 100 μm. (B) Compared to the MO-injected controls, ephrinb2 MO (0.5–1 mM)-injected embryos had impaired loop formation (white arrow) altered the DA and SV morphology, immature CVP and DLAV at 4 dpa (white arrowheads). Transient overexpression of ephrinb2 mRNA restored DAPT, DN-Notch1b mRNA (10–20 pg/nl) and Gata1a MO-impaired loop formation (white arrows). Scale bar: 20 μm. (C) Quantification of the proportion of embryos exhibiting loop formation and normalized area of vascular loop (*p< 0.05 vs. control MO, n = 20 per group). (D,E) Representative images of Matrigel and human aortic endothelial cell (HAEC) migration assays following siScr or siephrinb2 transfection. (F) The density quantification of ephrinb2 expression following siephrinb2 transfection. TCL: total cell lysates (G,H)siephrinb2 transfection reduced both tube length and the number of branch points as compared to siScr-transfected HAEC (*p< 0.05, **p< 0.005 vs. siScr, n = 5 for tube length, n = 4 for branch point). (I)siephrinb2 transfection reduced the attenuated area of recovery (A.O.R) by ~45% at 24 h post scratch (**p< 0.005 vs. siScr, n = 3 per group).

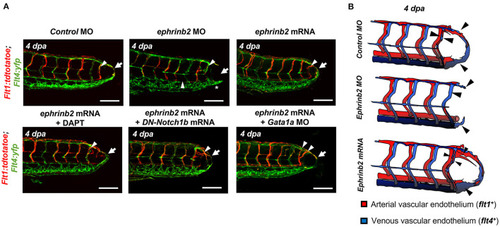
WSS-responsive Notch-ephrinb2 pathway regulates arterial network formation. (A) Injection of ephrinb2 MO (0.5-1mM) diminished flt1+ in the amputated site (white arrowheads) to attenuate loop formation at 4 dpa (white arrow). Transient overexpression of ephrinb2 mRNA promoted flt1+ network formation in the amputated site (white arrowheads) and restored DAPT and DN-Notch1b mRNA-impaired flt1+ regeneration (white arrow) (n = 20 per group). Scale bar: 20 μm. (B) Schematic representations of ephrinb2-dependent flt1+ and flt14+ regeneration. Black arrowheads depict regenerated flt1+ (Red) and flt4+ (Blue) in response to differential ephrinb2 expressions.

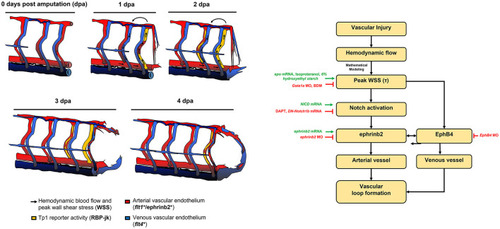
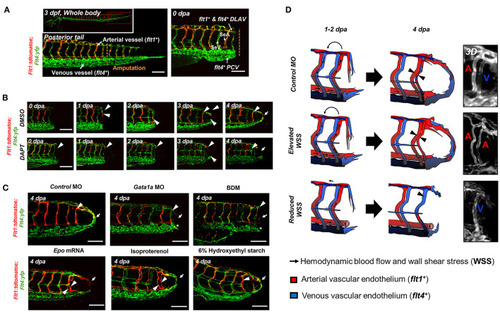
Schematic overviews of the proposed mechanisms underlying WSS-activated regrowth of the vascular loop.

Acknowledgments
This image is the copyrighted work of the attributed author or publisher, and ZFIN has permission only to display this image to its users. Additional permissions should be obtained from the applicable author or publisher of the image. Full text @ Front Cardiovasc Med