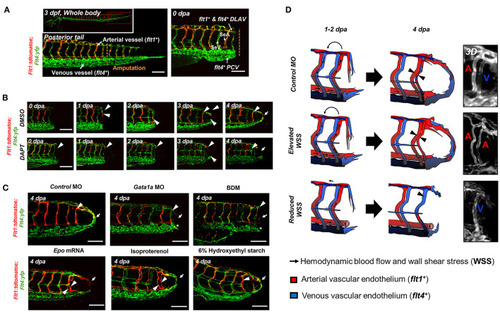
WSS promotes Notch-mediated arterial network. (A) A representative image of tail vasculature in the transgenic Tg(flt1:tdtomatoe; flt4: yfp) zebrafish line at 3 dpf. flt1+: arterial vascular endothelium, flt4+: venous vascular endothelium. flt1+ & flt4+ DLAV: flt1+ or flt4+ regenerated from the DLAV. flt4+ PCV: flt4+ regenerated from the PCV. Scale bar: 100 μm. (B) In response to DMSO treatment, flt1+ arteries preferentially formed an initial dorsal to ventral connection between the DLAV (flt1+ DLAV) and the DA in the amputated site (white arrowhead). Between 1–2 dpa, flt4+ veins from the DLAV (flt4+ DLAV) regenerated toward the DA exhibiting collateral arterial phenotype (overlapped yellow, white arrowheads). While regeneration of flt4+ veins occurred in the PCV (flt4+ PCV) and DLAV (flt4+ DLAV) for loop formation between 2–3 dpa, the distal segmental network exhibited enhanced flt1 expression at 3 dpa. flt1+ arteries extended dorsally from SeA at 4 dpa and formed a vascular loop with flt4+ PCV (white arrow). Conversely, DAPT treatment inhibited the initial connections of both flt1+ arteries and flt4+ veins at 2 dpa and partially inhibited both flt4+ DLAV and CVP at 3 dpa (white arrowheads). At 4 dpa, DAPT treatment inhibited flt1+network (white arrowheads) and attenuated loop formation at 4 dpa (white arrows, n = 5 per group). Scale bar: 20 μm. (C) Following tail amputation, Gata1a MO injection or BDM treatment diminished flt1+ in the amputated site (white arrowheads) and partially attenuated flt4+ DLAV and PCV (*asterisk, n = 20 per group). Increase in WSS (epo mRNA, isoproterenol, 6% hydroxyethyl hetastarch) enhanced flt1+ network (white arrowheads) during loop formation (white arrows) as compared to MO-injected controls. (n = 20 per group). Scale bar: 20 μm. (D) Schematic representations and 3-dimensional (3D) overview of WSS-mediated arterial- and venous- regeneration. Black arrowheads depict regenerated flt1+ (Red) and flt4+ network (Blue) in response to changes in WSS.
|
